Which type of graph would Be appropriate to display the percentage is in the table? line graph boxplot Histogram bar graph stemplot pie chart ?
Which type of graph would Be appropriate to display the percentage is in the table? line graph boxplot Histogram bar graph stemplot pie chart ?

Chapter1: Whole Numbers
Section: Chapter Questions
Problem 579PT: Determine which of the following numbers are (a) counting numbers (b) whole numbers. 4, 87

Related questions

Question
100%
Which type of graph would Be appropriate to display the percentage is in the table?
line graph
boxplot
Histogram
bar graph
stemplot
pie chart ?
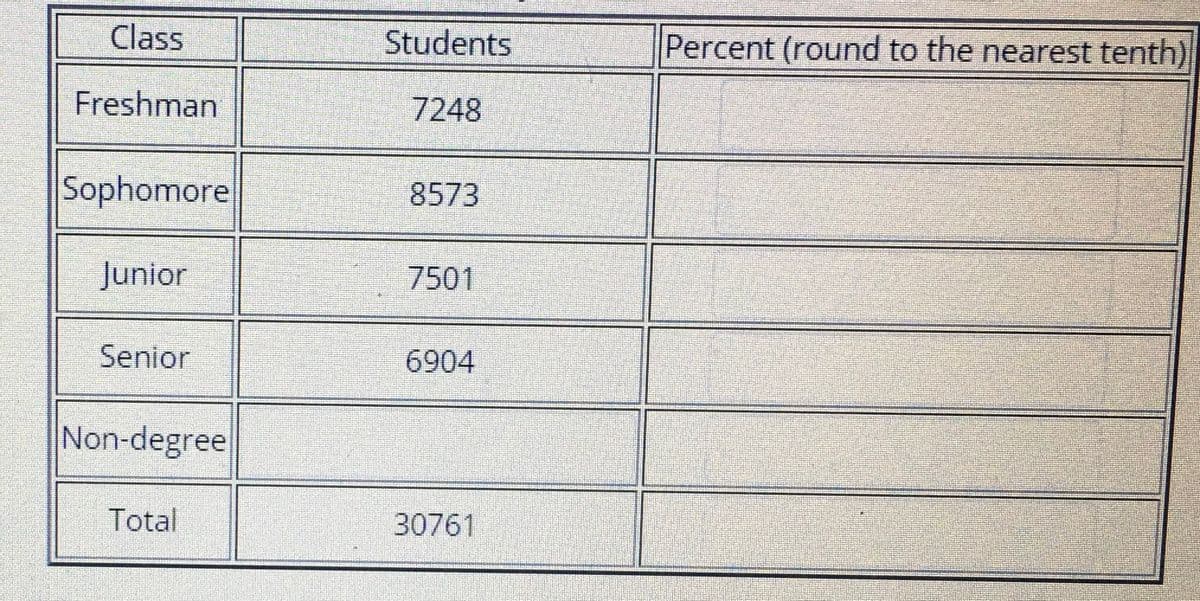
Transcribed Image Text:Class
Students
Percent (round to the nearest tenth)
Freshman
7248
Sophomore
8573
Junior
7501
Senior
6904
Non-degree
Total
30761
Expert Solution
This question has been solved!
Explore an expertly crafted, step-by-step solution for a thorough understanding of key concepts.

Step by step
Solved in 2 steps

Knowledge Booster


Learn more about
Need a deep-dive on the concept behind this application? Look no further. Learn more about this topic, statistics and related others by exploring similar questions and additional content below.Recommended textbooks for you