Draw the correct bar graph of obesity rates for Maine, Florida, Mississippi, Colorado, and Wisconsin. Would you please explain for understanding?
Draw the correct bar graph of obesity rates for Maine, Florida, Mississippi, Colorado, and Wisconsin. Would you please explain for understanding?

Glencoe Algebra 1, Student Edition, 9780079039897, 0079039898, 2018
18th Edition
ISBN:9780079039897
Author:Carter
Publisher:Carter
Chapter10: Statistics
Section10.6: Summarizing Categorical Data
Problem 30PPS

Related questions
Question
Draw the correct bar graph of obesity rates for Maine, Florida, Mississippi, Colorado, and Wisconsin. Would you please explain for understanding?
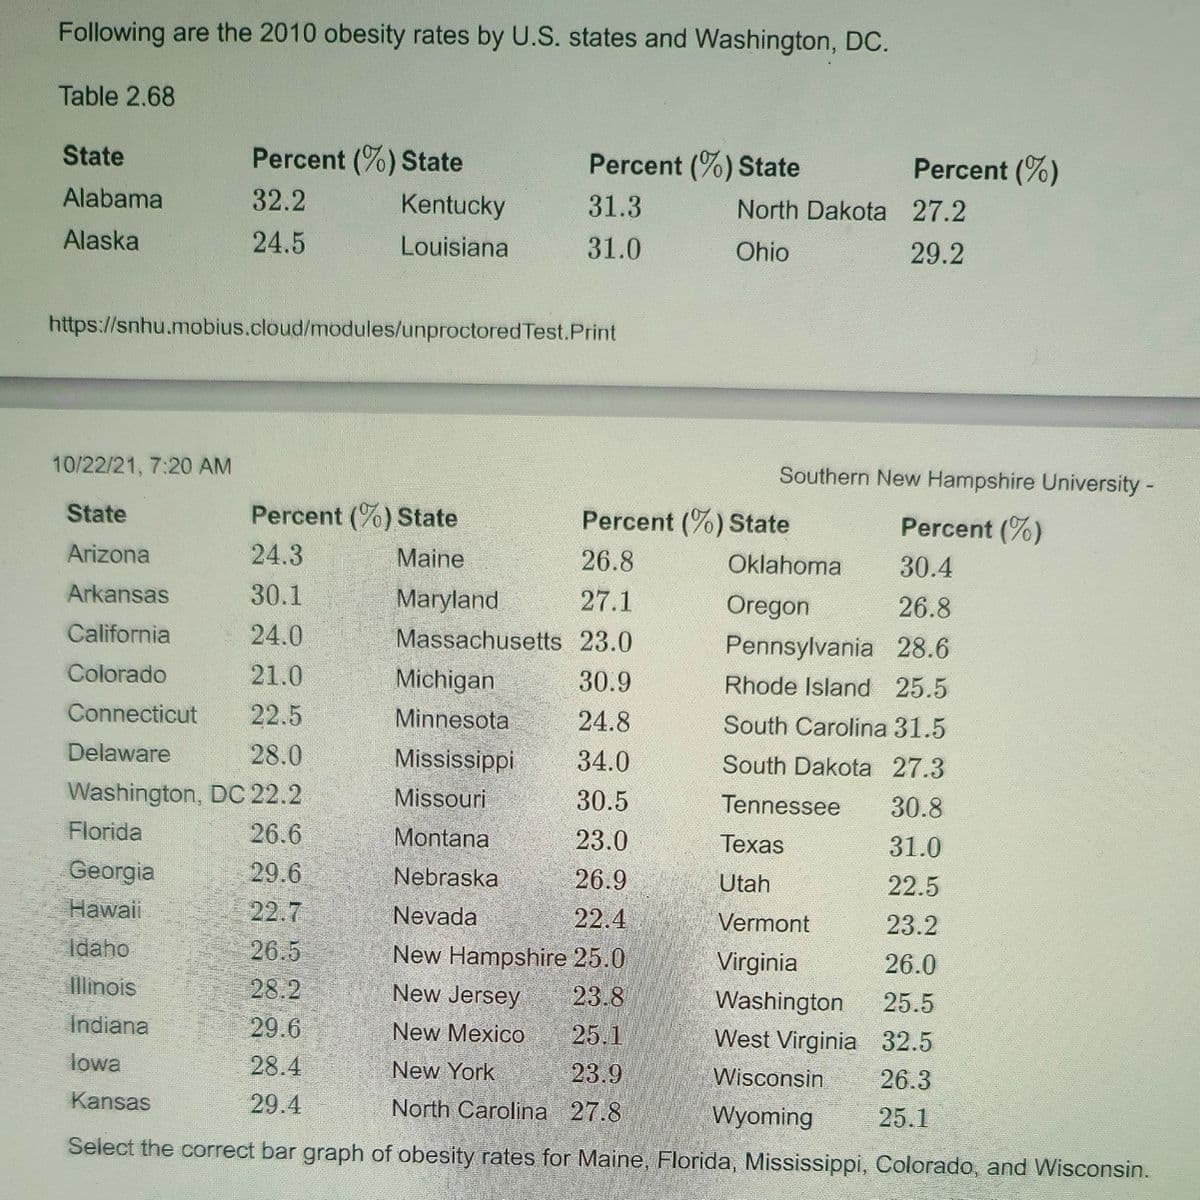
Transcribed Image Text:Following are the 2010 obesity rates by U.S. states and Washington, DC.
Table 2.68
State
Percent (%) State
Percent (%) State
Percent (%)
Alabama
32.2
Kentucky
31.3
North Dakota 27.2
Alaska
24.5
Louisiana
31.0
Ohio
29.2
https://snhu.mobius.cloud/modules/unproctoredTest.Print
10/22/21, 7:20 AM
Southern New Hampshire University-
State
Percent (%)State
Percent (%) State
Percent (%)
Arizona
24.3
Maine
26.8
Oklahoma
30.4
30.1
27.1
26.8
Maryland
Massachusetts 23.0
Arkansas
Oregon
California
24.0
Pennsylvania 28.6
Colorado
21.0
Michigan
30.9
Rhode Island 25.5
Connecticut
22.5
Minnesota
24.8
South Carolina 31.5
Delaware
28.0
Mississippi
34.0
South Dakota 27.3
Washington, DC 22.2
Missouri
30.5
Tennessee
30.8
Florida
26.6
Montana
23.0
Texas
31.0
29.6
22.7
Georgia
Nebraska
26.9
Utah
22.5
Нawai
Nevada
22.4
Vermont
23.2
Idaho
26.5
New Hampshire 25.0
Virginia
26.0
llinois
28.2
New Jersey
23.8
25.5
Washington
West Virginia 32.5
İndiana
29.6
New Mexico
25.1
lowa
28.4
New York
23.9
Wisconsin
26.3
Kansas
29.4
North Carolina 27.8
Wyoming
25.1
Select the correct bar graph of obesity rates for Maine, Florida, Mississippi, Colorado, and Wisconsin.
Expert Solution
This question has been solved!
Explore an expertly crafted, step-by-step solution for a thorough understanding of key concepts.

This is a popular solution!

Trending now
This is a popular solution!

Step by step
Solved in 3 steps with 1 images

Recommended textbooks for you
Glencoe Algebra 1, Student Edition, 9780079039897…
Algebra
ISBN:
9780079039897
Author:
Carter
Publisher:
McGraw Hill

Holt Mcdougal Larson Pre-algebra: Student Edition…
Algebra
ISBN:
9780547587776
Author:
HOLT MCDOUGAL
Publisher:
HOLT MCDOUGAL

College Algebra (MindTap Course List)
Algebra
ISBN:
9781305652231
Author:
R. David Gustafson, Jeff Hughes
Publisher:
Cengage Learning
Glencoe Algebra 1, Student Edition, 9780079039897…
Algebra
ISBN:
9780079039897
Author:
Carter
Publisher:
McGraw Hill
Holt Mcdougal Larson Pre-algebra: Student Edition…
Algebra
ISBN:
9780547587776
Author:
HOLT MCDOUGAL
Publisher:
HOLT MCDOUGAL
College Algebra (MindTap Course List)
Algebra
ISBN:
9781305652231
Author:
R. David Gustafson, Jeff Hughes
Publisher:
Cengage Learning
