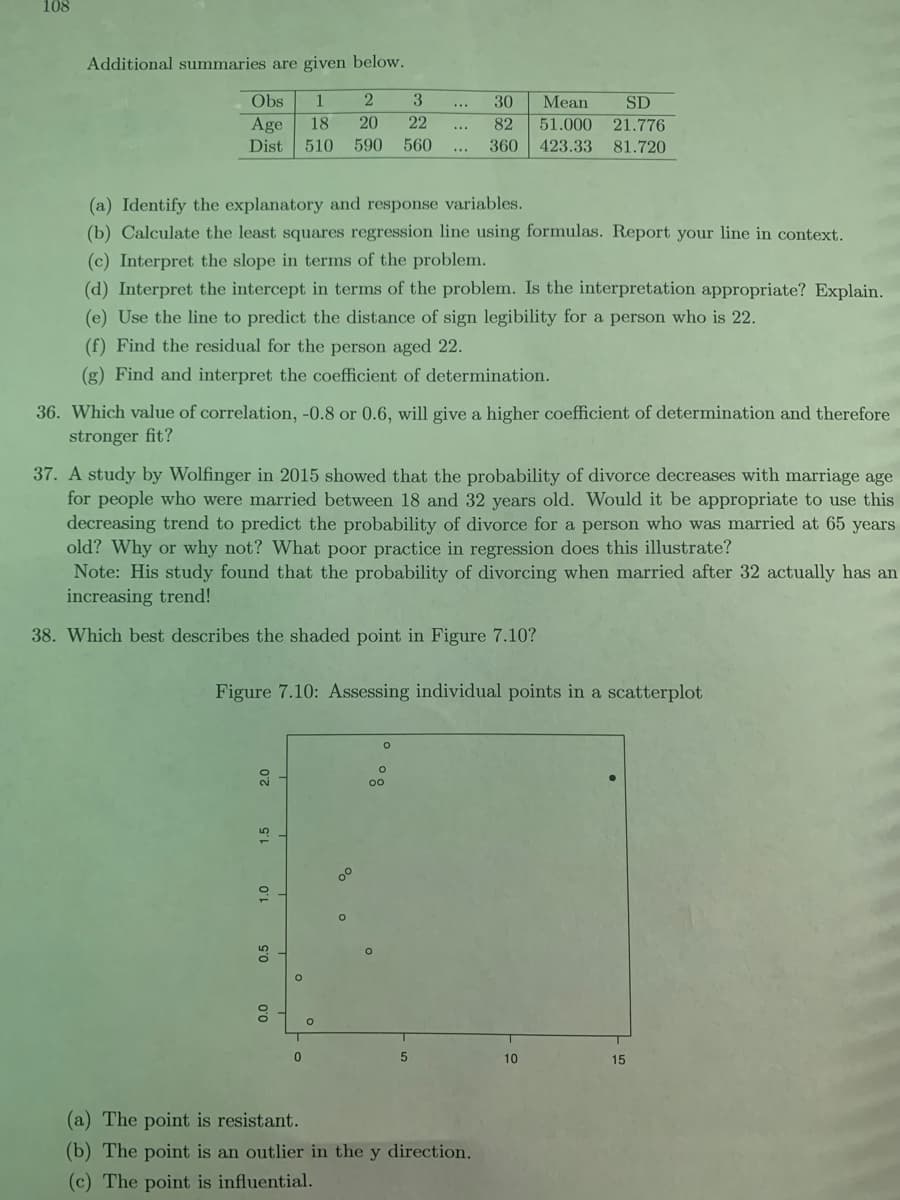
Which value of correlation, -0.8 or 0.6, will give a higher coefficient of determination and therefore stronger fit?

MATLAB: An Introduction with Applications
6th Edition
ISBN:9781119256830
Author:Amos Gilat
Publisher:Amos Gilat
Chapter1: Starting With Matlab
Section: Chapter Questions
Problem 1P
icon
Related questions
icon
Concept explainers
Topic Video
Question
Question 36
108
Additional summaries are given below.
Obs
1
3
30
Mean
SD
Age
18
20
22
82
51.000 21.776
Dist
510
590
560
360
423.33 81.720
...
(a) Identify the explanatory and response variables.
(b) Calculate the least squares regression line using formulas. Report your line in context.
(c) Interpret the slope in terms of the problem.
(d) Interpret the intercept in terms of the problem. Is the interpretation appropriate? Explain.
(e) Use the line to predict the distance of sign legibility for a person who is 22.
(f) Find the residual for the person aged 22.
(g) Find and interpret the coefficient of determination.
36. Which value of correlation, -0.8 or 0.6, will give a higher coefficient of determination and therefore
stronger fit?
37. A study by Wolfinger in 2015 showed that the probability of divorce decreases with marriage age
for people who were married between 18 and 32 years old. Would it be appropriate to use this
decreasing trend to predict the probability of divorce for a person who was married at 65 years
old? Why or why not? What poor practice in regression does this illustrate?
Note: His study found that the probability of divorcing when married after 32 actually has an
increasing trend!
38. Which best describes the shaded point in Figure 7.10?
Figure 7.10: Assessing individual points in a scatterplot
20
00
10
5
10
15
(a) The point is resistant.
(b) The point is an outlier in the y direction.
(c) The point is influential.
0.5
1.5
0'0
Transcribed Image Text:108 Additional summaries are given below. Obs 1 3 30 Mean SD Age 18 20 22 82 51.000 21.776 Dist 510 590 560 360 423.33 81.720 ... (a) Identify the explanatory and response variables. (b) Calculate the least squares regression line using formulas. Report your line in context. (c) Interpret the slope in terms of the problem. (d) Interpret the intercept in terms of the problem. Is the interpretation appropriate? Explain. (e) Use the line to predict the distance of sign legibility for a person who is 22. (f) Find the residual for the person aged 22. (g) Find and interpret the coefficient of determination. 36. Which value of correlation, -0.8 or 0.6, will give a higher coefficient of determination and therefore stronger fit? 37. A study by Wolfinger in 2015 showed that the probability of divorce decreases with marriage age for people who were married between 18 and 32 years old. Would it be appropriate to use this decreasing trend to predict the probability of divorce for a person who was married at 65 years old? Why or why not? What poor practice in regression does this illustrate? Note: His study found that the probability of divorcing when married after 32 actually has an increasing trend! 38. Which best describes the shaded point in Figure 7.10? Figure 7.10: Assessing individual points in a scatterplot 20 00 10 5 10 15 (a) The point is resistant. (b) The point is an outlier in the y direction. (c) The point is influential. 0.5 1.5 0'0
Expert Solution
trending now

Trending now

This is a popular solution!

steps

Step by step

Solved in 2 steps with 2 images

Blurred answer
Knowledge Booster
Sample space, Events, and Basic Rules of Probability
Learn more about
Need a deep-dive on the concept behind this application? Look no further. Learn more about this topic, statistics and related others by exploring similar questions and additional content below.
Similar questions
  • SEE MORE QUESTIONS
Recommended textbooks for you
MATLAB: An Introduction with Applications
Statistics
ISBN:
9781119256830
Author:
Amos Gilat
Publisher:
John Wiley & Sons Inc
Probability and Statistics for Engineering and th…
Statistics
ISBN:
9781305251809
Author:
Jay L. Devore
Publisher:
Cengage Learning
Statistics for The Behavioral Sciences (MindTap C…
Statistics
ISBN:
9781305504912
Author:
Frederick J Gravetter, Larry B. Wallnau
Publisher:
Cengage Learning
Elementary Statistics: Picturing the World (7th E…
Statistics
ISBN:
9780134683416
Author:
Ron Larson, Betsy Farber
Publisher:
PEARSON
The Basic Practice of Statistics
Statistics
ISBN:
9781319042578
Author:
David S. Moore, William I. Notz, Michael A. Fligner
Publisher:
W. H. Freeman
Introduction to the Practice of Statistics
Statistics
ISBN:
9781319013387
Author:
David S. Moore, George P. McCabe, Bruce A. Craig
Publisher:
W. H. Freeman