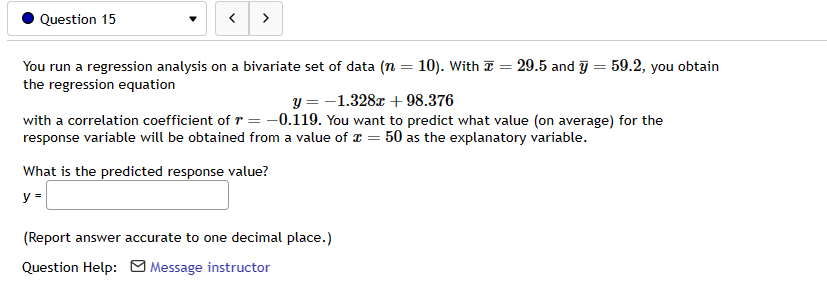
You run a regression analysis on a bivariate set of data (n = 10). With the regression equation What is the predicted response value? y = = y = -1.328x +98.376 with a correlation coefficient of r = -0.119. You want to predict what value (on average) for the response variable will be obtained from a value of x = 50 as the explanatory variable. (Report answer accurate to one decimal place.) 29.5 and y = 59.2, you obtain
Q: Below is a data set on various measures of 20 regions of a country. The murder rate is per 100,000,…
A: We are asked to establish the regression model for life expectancy using 3 predictor variables among…
Q: Hello there, can you help me solve the problem with two subparts (b and c)? Thank you Problem:…
A: The hollowing data is given.Sales (x)Costs (y)41.5762.0582.5102.7123.1143.6163.8184.35
Q: The following data show a list of 30 observations and an estimated probability of Class 1 membership…
A: First, let's arrange the information for each cutoff value (0.75, 0.5, and 0.25), creating a…
Q: Given: T₁ = 35 81 = 3 n1 = 16 T₂ = 40 82=4 N2 20 H₂= μ1 = 1₂ Ha: 11 <1₂ You accept the null…
A: From the provided information,
Q: Five years ago, the average math SAT score for students at one school was 475. A teacher wants to…
A: The objective of this question is to perform a hypothesis test to determine whether the mean math…
Q: 4.1-3. Let the joint pmf of X and Y be defined by x + y 32 f(x, y) = a. Find fx (x), the marginal…
A: Joint p.m.f of X and Y is defined by
Q: Consider the following data for two independent random samples taken from two normal populations.…
A: Since you have posted a question with multiple sub parts, we will provide the solution only to the…
Q: The state education commission wants to estimate the fraction of tenth grade students that have…
A: The objective of this question is to estimate the proportion of tenth graders reading at or below…
Q: Test the claim about the population mean, µ, at the given level of significance using the given…
A: The hypothesized mean is 50.
Q: Choose the correct There is a positive correlation between the size of a hospital (measured by…
A: It is given that, there is a positive correlation between the size of a hospital (measured by number…
Q: Test the claim about the population mean, µ, at the given level of significance using the given…
A: Suppose μ is the population mean.
Q: 14. Using your calculator, find a quadratic regression equation for years vs. adjusted gasoline…
A: The question is about regression.Given :To find :Quadratic regression equation, r and r2 values.
Q: Which table is used in hypothesis testing when sample size is 10 and sample standard deviation is…
A: Sample size(n)=10
Q: Calculate the Fisher asymmetry coefficient of the performance evaluation of seven employees in the…
A: The dataset is given as:EmployeeRating13.524.534.24352.763.374Mean: Standard deviation: We have to…
Q: what about (f)?
A: As per the guidelines of Bartleby guildlines we have to solve question as specify by student.Sample…
Q: Use the body table to find the specified z-number. (Round the answer to two decimal places.) (a)…
A: By using the body table to find the specified z-number.
Q: Solve for r with the following information: SSX = 10.21 SSy = 100.90 SScp = 30.57 Round to the third…
A: Given "r" represents the correlation coefficient. The given values are,
Q: An experiment was conducted to compare the alcohol content of soy sauce on two different production…
A: The null and alternative hypotheses are given as:Vs Level of significance: (assumed)Let us assume…
Q: A golf club manufacturer claims that golfers can lower their scores by using the manufacturer's…
A: The objective of this question is to test the manufacturer's claim that the newly designed golf…
Q: The average customer wait time at a QuickServe Restaurant chain is currently 8 minutes. The…
A: Given that the average waiting time for the customer is 8 minutes.The sample data suggested that the…
Q: The state education commission wants to estimate the fraction of tenth grade students that have…
A: The provided information is as follows:The total number of sample size is .The number of graders…
Q: The US Department of Energy reported that 49% of homes were heated by natural gas. A random sample…
A: The objective of this question is to test the claim that the proportion of homes in Oregon that are…
Q: 48. FILE Robert Altoff is vice president of engineering for a manufacturer of household washing…
A: "Since you have posted a question with multiple sub parts, we will solve the first 3 sub-parts for…
Q: I opened a grocery account at my bank with $150. Every week thereafter, I withdraw $95 from the…
A: We have given that a person opened a grocery account at my bank with $150.And they withdraw $95 from…
Q: 13. Using your calculator, find a linear regression equation for years vs. adjusted gasoline prices.…
A: Gas price per gallon { 1.30,1.47,1.14,1.47,1.50,1.82,2.32,2.27,3.05,1.79,2.73,3.09,3.40 } N = 13…
Q: Use the following data to estimate a regression with femur length as the x-variable and tibia length…
A: The variable “Femur Length” is defined as x and the variable “Tibia Length” is defined as y.
Q: A data set includes data from student evaluations of courses. The summary statistics are n=91,…
A: From the provided information,
Q: The following regression model was fitted to sample data with 12 observations: = 30 +4.50x. What is…
A: The regression equation isThe observed value is
Q: The desired distance for Flextronchip customers is 0.4 mm between two adjacent pins. Any deviation…
A: The provided information is as follows:The tolerance is .The total quality cost per chip is .The…
Q: 2) . In February 2021, the Chicago Tribune reported: “The overdose epidemic that has ravaged Chicago…
A: Given the data asState2019 Per Capita IncomeOverdose Death Rate (per 100,000)Alabama $…
Q: Fortune publishes data on sales, profits, assets, stockholders' equity, market value, and earnings…
A: The provided information is as follows:The sample size is to be selected is carporations.The total…
Q: A random sample of n₁ = 10 regions in New England gave the following violent crime rates (per…
A: Given:New England Crime RateRocky Mountain Crime…
Q: State the null and alternative hypotheses. O Ho: At least one p, is different from the specified…
A: Let p1, p2, and p3 be the three population proportions.Given that,No. of applicants The proportions…
Q: A particular fruit's weights are normally distributed, with a mean of 641 grams and a standard…
A: Suppose a random variable x defines the weight of a randomly selected fruit.
Q: 15. Let X and Y be continuous random variables with joint density function 24xy for x>0, y>0,…
A: The joint density function for and is
Q: The Kyoto Protocol was signed in 1997, and required countries to start reducing their carbon…
A: It is given that in 2004, the mean emission was 4.87 metric tons per capita.For testing the claim…
Q: In a sample of 183 male job-holders, 55% said that they are satisfied with their jobs. In another…
A: Sample data for the females is given as:Number of females in the sample: Sample proportion of…
Q: find the standard deviation for the group of data items stem 1 = 6,7,7,6,5,6 stem 2 = 0,3,2,0
A: stem 1 =6,7,7,6,5,6stem 2=0,3,2,0
Q: Out of 199199 randomly selected adults in the United States who were surveyed, 8888 exercise on a…
A: Suppose p is the true population proportion of all adults in the Country US, who exercise on a…
Q: Give an example of two variables that you would expect to have a correlation close to or equal to 1.…
A: High Positive Correlation (Close to 1):Example:The number of hours a student spends studying and…
Q: It is believed that 11% of all Americans are left-handed. A college needs to know how many…
A: Given thatSample size =120Number of left handed=15Population proportion=0.11Population…
Q: 4.1-3. Let the joint pmf of X and Y be defined by f(x, y) = x+y 32 a. Find fx (x), the marginal pmf…
A: According to the Bartleby guidelines experts solve only one question and a maximum of three sub…
Q: 人工知能を使用せず、すべてを段階的にデジタル形式で解決してください。 ありがとう SOLVE STEP BY STEP IN DIGITAL FORMAT DON'T USE CHATGPT…
A: Given,Population of elephantsMean(μ)=5000Standard deviation (σ)=400Population of…
Q: (a) Using the correct notation, define the parameter of interest. Then, state the null and…
A: Let be the population mean tensile strength.Given that,Sample size Population mean Assume the level…
Q: For a hypothesis test of the claim that the mean amount of sleep for adults is less than 9 hours,…
A: The question is about statistical power and error.Given :Claim statement : Mean amount of sleep for…
Q: Winston's assembly unit has decided to use a p-Chart with an a risk of 1 % to monitor the proportion…
A: Given that the production manager randomly samples 200 metal shafts at 16 successively selected time…
Q: A company that makes cola drinks states that the mean caffeine content per 12-ounce bottle of cola…
A: The claim is that the mean caffeine content per 12-ounce bottle of cola is 40 milligrams.
Q: The following data represent tree trunk circumferences (in mm) foa a random sample of 60 6-year old…
A: The data on tree trunk circumferences (in mm) is given…
Q: A rural county hospital offers several health services. The hospital administrators conducted a poll…
A: The given data is as follows: Male FemaleTotalSatisfied384416800Not…
Q: A survey asked, "Do you think that homeless people are responsible for the situation they are in?"…
A: Since you have posted a question with multiple sub-parts, we will solve first three subparts for…
For the homework how do I find y?
Step by step
Solved in 3 steps with 2 images
- Olympic Pole Vault The graph in Figure 7 indicates that in recent years the winning Olympic men’s pole vault height has fallen below the value predicted by the regression line in Example 2. This might have occurred because when the pole vault was a new event there was much room for improvement in vaulters’ performances, whereas now even the best training can produce only incremental advances. Let’s see whether concentrating on more recent results gives a better predictor of future records. (a) Use the data in Table 2 (page 176) to complete the table of winning pole vault heights shown in the margin. (Note that we are using x=0 to correspond to the year 1972, where this restricted data set begins.) (b) Find the regression line for the data in part ‚(a). (c) Plot the data and the regression line on the same axes. Does the regression line seem to provide a good model for the data? (d) What does the regression line predict as the winning pole vault height for the 2012 Olympics? Compare this predicted value to the actual 2012 winning height of 5.97 m, as described on page 177. Has this new regression line provided a better prediction than the line in Example 2?Question 1. You run a regression analysis on a bivariate set of data (n=39n=39). With ¯x=44.2x¯=44.2 and ¯y=51.3y¯=51.3, you obtain the regression equationy=3.403x−61.618y=3.403x-61.618with a correlation coefficient of r=0.265r=0.265. You want to predict what value (on average) for the response variable will be obtained from a value of 80 as the explanatory variable.What is the predicted response value?y = (Report answer accurate to one decimal place.) Question 2. See the attachmentQuestion #6 Listed below are altitudes (thousands of feet) and outside air temperatures (°F) recorded during a flight. Find the (a) explained variation, (b) unexplained variation, and (c) indicated prediction interval. There is sufficient evidence to support a claim of a linear correlation, so it is reasonable to use the regression equation when making predictions. For the prediction interval, use a 95% confidence level with the altitude of 6327 ft (or 6.327 thousand feet). Altitude 4 8 14 24 27 31 32 Temperature 55 37 20 −5 −27 −41 −57 a. Find the explained variation. ______________ (Round to two decimal places as needed.) b. Find the unexplained variation. _______________ (Round to five decimal places as needed.) c. Find the indicated prediction interval. _____________°F < y < ____________ °F (Round to four decimal places as needed.)
- Question 17: You run a regression analysis on a bivariate set of data (n=103n=103). With ¯x=24.3x¯=24.3 and ¯y=75.9y¯=75.9, you obtain the regression equationy=0.659x+59.886y=0.659x+59.886with a correlation coefficient of r=0.883r=0.883. You want to predict what value (on average) for the response variable will be obtained from a value of x=90x=90 as the explanatory variable.What is the predicted response value?y = (Report answer accurate to one decimal place.)Question 15: You run a regression analysis on a bivariate set of data (n=79n=79). You obtain the regression equationy=3.362x−24.355y=3.362x-24.355with a correlation coefficient of r=0.725r=0.725 (which is significant at α=0.01α=0.01). You want to predict what value (on average) for the explanatory variable will give you a value of 10 on the response variable.What is the predicted explanatory value?x = (Report answer accurate to one decimal place.)Question #9 The table below lists weights (carats) and prices (dollars) of randomly selected diamonds. Find the (a) explained variation, (b) unexplained variation, and (c) indicated prediction interval. There is sufficient evidence to support a claim of a linear correlation, so it is reasonable to use the regression equation when making predictions. For the prediction interval, use a 95% confidence level with a diamond that weighs 0.8 carats. Weight 0.3 0.4 0.5 0.5 1.0 0.7 Price $513 $1175 $1335 $1401 $5659 $2266 a. Find the explained variation. ______________ (Round to the nearest whole number as needed.) b. Find the unexplained variation. _______________ (Round to the nearest whole number as needed.) c. Find the indicated prediction interval. $ _____________ < y < $ ____________ (Round to the nearest whole number as needed.)