With the following data in 6 cities, calculate the coefficient of correlation by Pearson’s method between the density of population and death rate: Cities ABCDEF Area in sq. kilometre 150 Population in ‘000’ 30 No. of Deaths 300 180 100 60 120 80 9040427224 1440 560 840 1224 312
With the following data in 6 cities, calculate the coefficient of correlation by Pearson’s method between the density of population and death rate: Cities ABCDEF Area in sq. kilometre 150 Population in ‘000’ 30 No. of Deaths 300 180 100 60 120 80 9040427224 1440 560 840 1224 312

Linear Algebra: A Modern Introduction
4th Edition
ISBN:9781285463247
Author:David Poole
Publisher:David Poole
Chapter2: Systems Of Linear Equations
Section2.4: Applications
Problem 2EQ: 2. Suppose that in Example 2.27, 400 units of food A, 500 units of B, and 600 units of C are placed...

Related questions
Question
With the following data in 6 cities, calculate the coefficient of
Cities ABCDEF
Area in sq. kilometre 150 Population in ‘000’ 30 No. of Deaths 300
180 100 60 120 80 9040427224 1440 560 840 1224 312
Transcribed Image Text:UNIVERSITY OF TOMORROW
UNIVERSITY OF PETROLEUM & ENERGY STUDIES, DEHRADUN
Department of Applied Sciences-Mathematics
Assignment 2 (CO5)
Program: B.Sc. F & T, B.Sc. Clinical Research and B.Sc. Microbiology
Integrated B.Sc. F & T, Integrated B.Sc. Clinical Research, and Integrated B.Sc.
Microbiology
Semester: II Course: Biostatistics and Epidemiology Course Code: HSCC2006
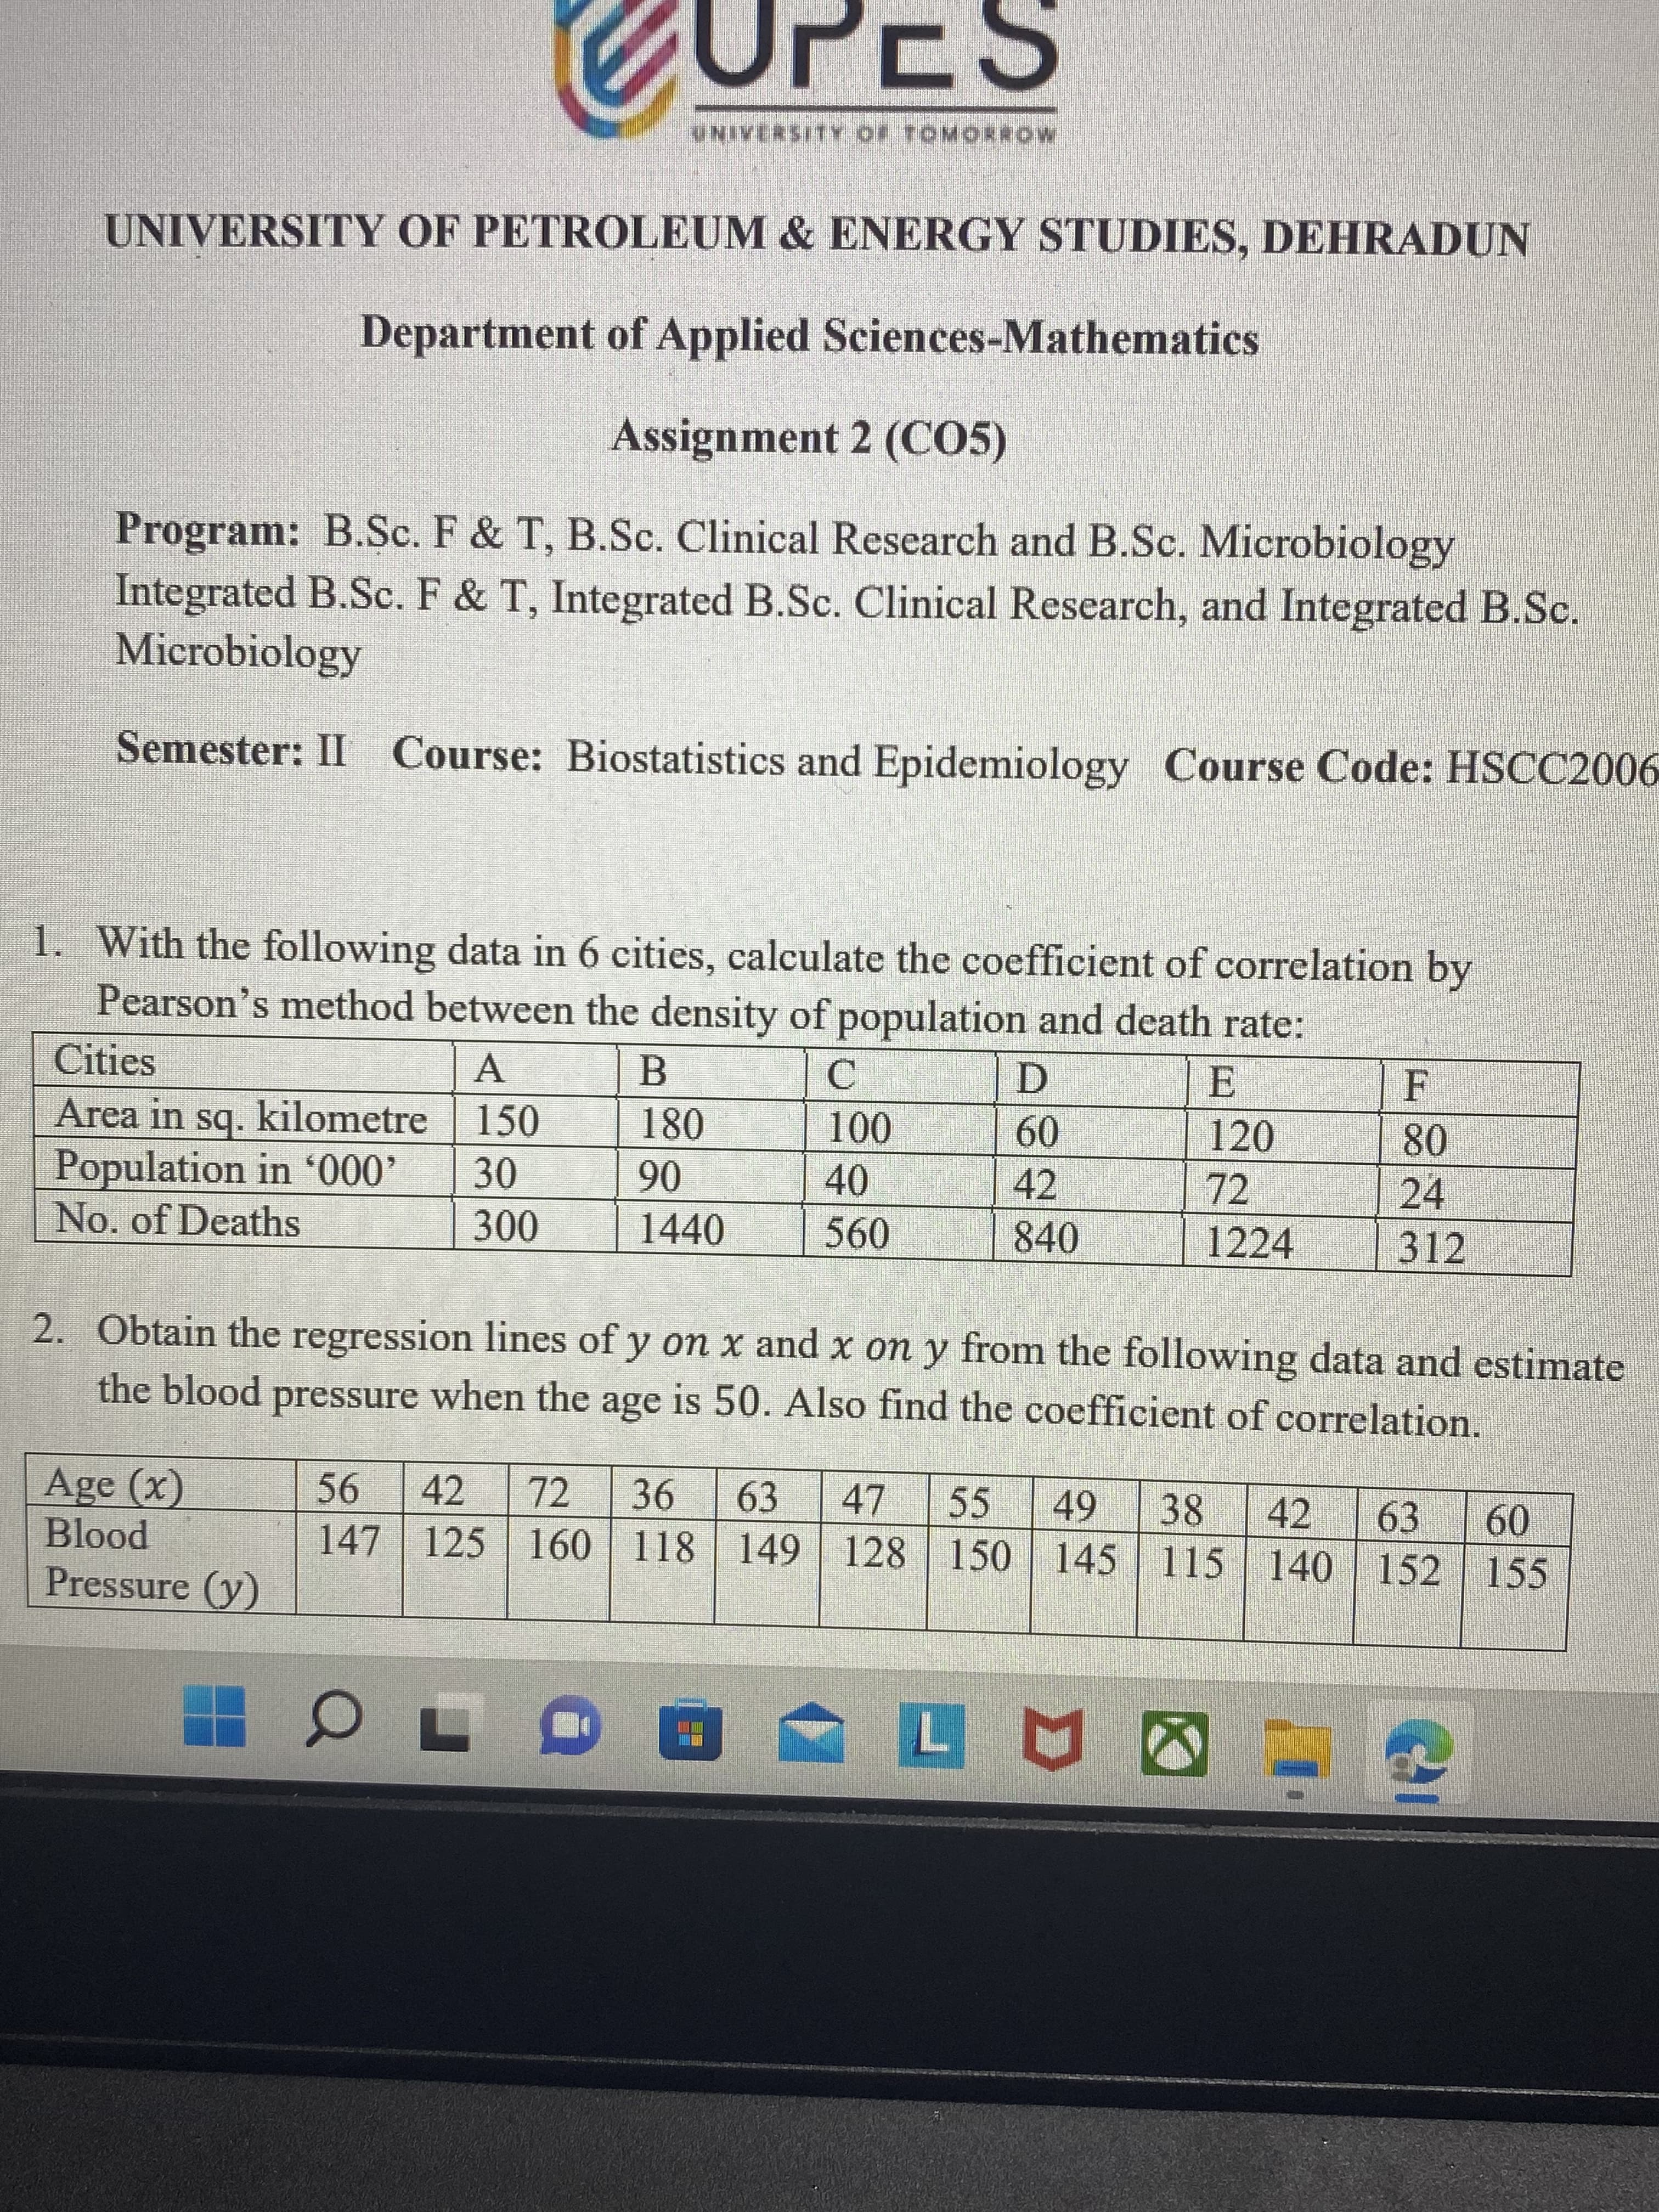
1. With the following data in 6 cities, calculate the coefficient of correlation by
Pearson's method between the density of population and death rate:
Cities
Area in sq. kilometre| 150
Population in '000'
E.
120
B
F
A.
D.
180
100
09
42
08
24
06
1440
72
30
40
No. of Deaths
840
1224
312
2. Obtain the regression lines of y on x and x on y from the following data and estimate
the blood pressure when the age is 50. Also find the coefficient of correlation.
Age (x)
42
72
63
47
147 125 160 118 149 128 150
55
38
42
63
09
pool
Pressure (y)
| 145 115 140 152 155
Expert Solution
This question has been solved!
Explore an expertly crafted, step-by-step solution for a thorough understanding of key concepts.

Step by step
Solved in 3 steps

Recommended textbooks for you
Linear Algebra: A Modern Introduction
Algebra
ISBN:
9781285463247
Author:
David Poole
Publisher:
Cengage Learning

College Algebra (MindTap Course List)
Algebra
ISBN:
9781305652231
Author:
R. David Gustafson, Jeff Hughes
Publisher:
Cengage Learning
Linear Algebra: A Modern Introduction
Algebra
ISBN:
9781285463247
Author:
David Poole
Publisher:
Cengage Learning
College Algebra (MindTap Course List)
Algebra
ISBN:
9781305652231
Author:
R. David Gustafson, Jeff Hughes
Publisher:
Cengage Learning