Hint: to perform the analysis, the easiest way is to copy and paste the data into MS Excel and use the Data Analysis ToolPak to perform the requested calculations. Assume the treatment groups have equal variance Answer to 3 decimals unless otherwise specified. All of these numbers are generated in the Data Analysis ToolPak: = pooled variance = degrees of freedom (whole number) = calculated t statistic reported by the data analysis tool pack (NOTE: t statistic should always be a positive number) = P value reported by the data analysis tool pack (answer to 3 significant figures) = critical 0.05, df reported by the data analysis tool pack.
Hint: to perform the analysis, the easiest way is to copy and paste the data into MS Excel and use the Data Analysis ToolPak to perform the requested calculations. Assume the treatment groups have equal variance Answer to 3 decimals unless otherwise specified. All of these numbers are generated in the Data Analysis ToolPak: = pooled variance = degrees of freedom (whole number) = calculated t statistic reported by the data analysis tool pack (NOTE: t statistic should always be a positive number) = P value reported by the data analysis tool pack (answer to 3 significant figures) = critical 0.05, df reported by the data analysis tool pack.

Big Ideas Math A Bridge To Success Algebra 1: Student Edition 2015
1st Edition
ISBN:9781680331141
Author:HOUGHTON MIFFLIN HARCOURT
Publisher:HOUGHTON MIFFLIN HARCOURT
Chapter11: Data Analysis And Displays
Section11.3: Shapes Of Distributions
Problem 20E

Related questions
Question
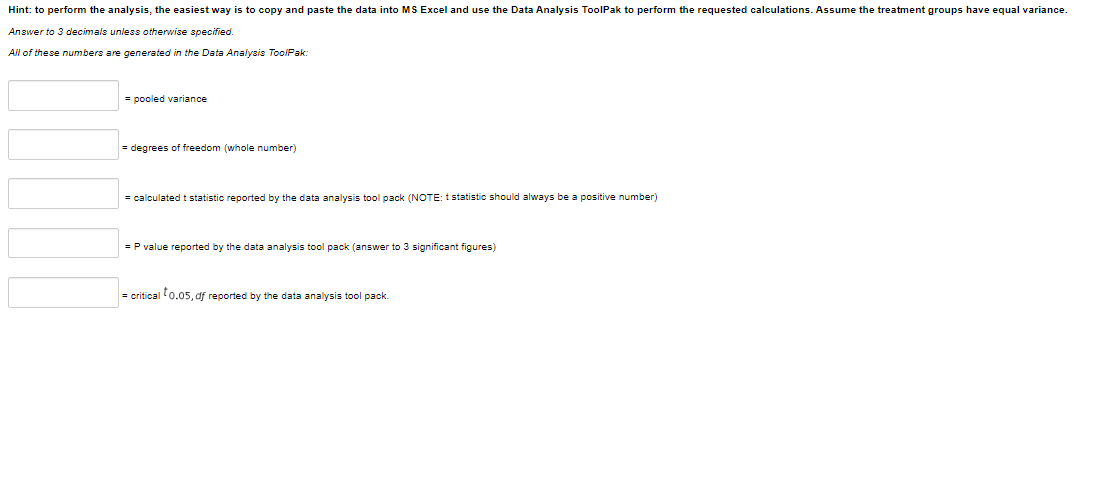
Transcribed Image Text:Hint: to perform the analysis, the easiest way is to copy and paste the data into MS Excel and use the Data Analysis ToolPak perform the requested calculations. Assume the treatment groups have equal variance.
Answer to 3 decimals unless otherwise specified.
All of these numbers are generated in the Data Analysis ToolPak:
= pooled variance
= degrees of freedom (whole number)
= calculated t statistic reported by the data analysis tool pack (NOTE: t statistic should always be a positive number)
= P value reported by the data analysis tool pack (answer to 3 significant figures)
= critical 0.05, df reported by the data analysis tool pack.
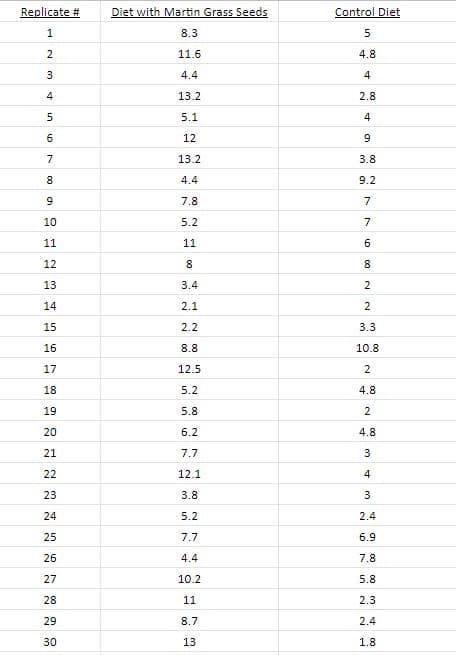
Transcribed Image Text:Replicate #
1
AWNH
2
3
4
567
8
9
10
11
12
13
14
15
16
17
18
19
20
21
22
23
24
25
26
27
28
29
30
Diet with Martin Grass Seeds
8.3
11.6
4.4
13.2
5.1
12
13.2
4.4
7.8
5.2
11
8
3.4
2.1
2.2
8.8
12.5
5.2
5.8
6.2
7.7
12.1
3.8
5.2
7.7
4.4
10.2
11
8.7
13
Control Diet
5
4.8
4
2.8
4
9
3.8
9.2
7
7
10 00
6
8
2
2
3.3
10.8
2
4.8
2
4.8
3
4
3
2.4
6.9
7.8
5.8
2.3
2.4
1.8
Expert Solution
This question has been solved!
Explore an expertly crafted, step-by-step solution for a thorough understanding of key concepts.

This is a popular solution!

Trending now
This is a popular solution!

Step by step
Solved in 3 steps with 5 images

Follow-up Questions
Read through expert solutions to related follow-up questions below.
Recommended textbooks for you
Big Ideas Math A Bridge To Success Algebra 1: Stu…
Algebra
ISBN:
9781680331141
Author:
HOUGHTON MIFFLIN HARCOURT
Publisher:
Houghton Mifflin Harcourt

Glencoe Algebra 1, Student Edition, 9780079039897…
Algebra
ISBN:
9780079039897
Author:
Carter
Publisher:
McGraw Hill
Big Ideas Math A Bridge To Success Algebra 1: Stu…
Algebra
ISBN:
9781680331141
Author:
HOUGHTON MIFFLIN HARCOURT
Publisher:
Houghton Mifflin Harcourt
Glencoe Algebra 1, Student Edition, 9780079039897…
Algebra
ISBN:
9780079039897
Author:
Carter
Publisher:
McGraw Hill