Fill in the missing values in the contingency table. Round your expected frequencies to two or more decimal places, and round your (fo-JE)² JE values to
Fill in the missing values in the contingency table. Round your expected frequencies to two or more decimal places, and round your (fo-JE)² JE values to

Chapter9: Sequences, Probability And Counting Theory
Section9.7: Probability
Problem 1SE: What term is used to express the likelihood of an event occurring? Are there restrictions on its...

Related questions
Question
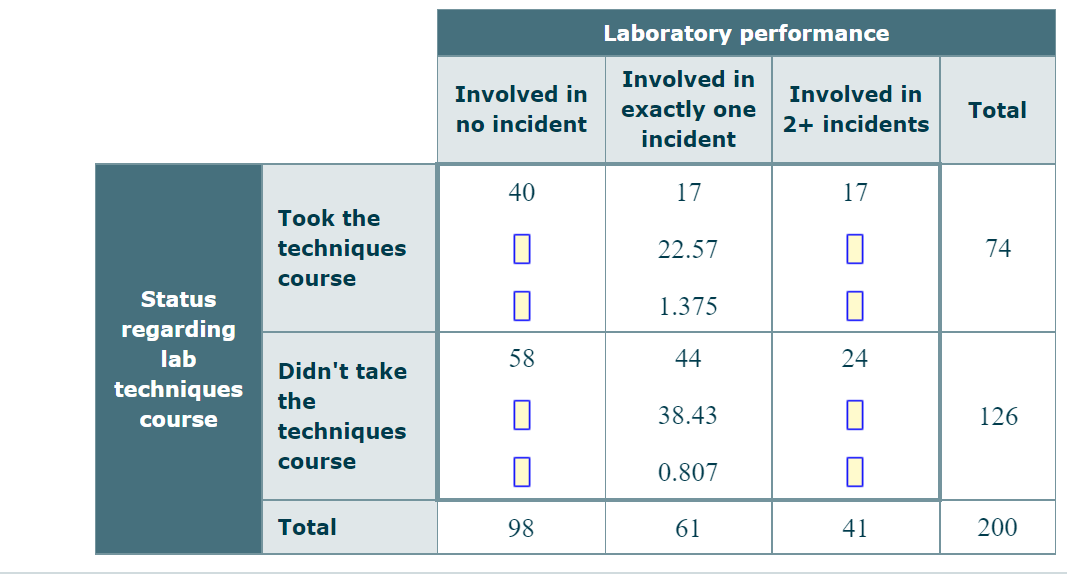
Transcribed Image Text:Status
regarding
lab
techniques
course
Took the
techniques
course
Didn't take
the
techniques
course
Total
Involved in
no incident
40
58
98
Laboratory performance
Involved in
exactly one
incident
17
22.57
1.375
44
38.43
0.807
61
Involved in
2+ incidents
17
0
24
0
41
Total
74
126
200
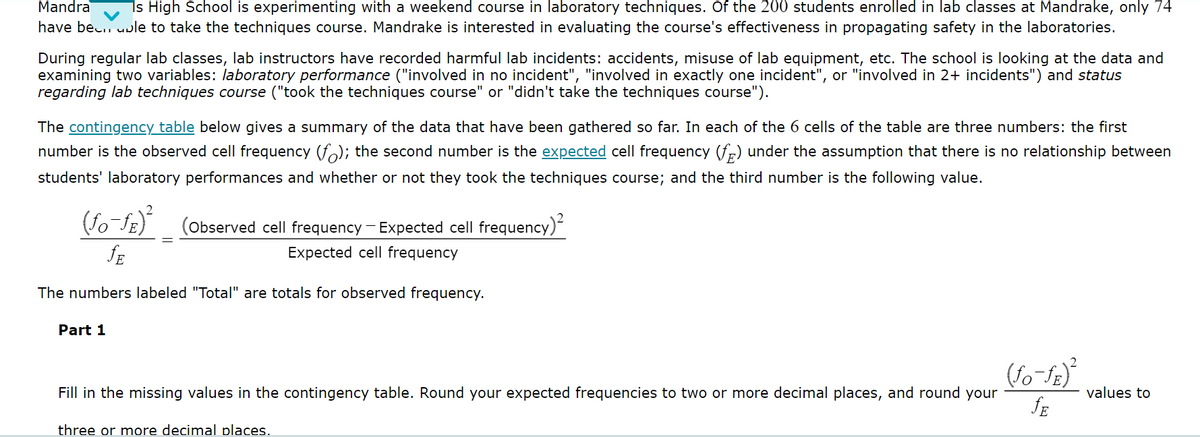
Transcribed Image Text:Mandra Is High School is experimenting with a weekend course in laboratory techniques. Of the 200 students enrolled in lab classes at Mandrake, only 74
have been able to take the techniques course. Mandrake is interested in evaluating the course's effectiveness in propagating safety in the laboratories.
During regular lab classes, lab instructors have recorded harmful lab incidents: accidents, misuse of lab equipment, etc. The school is looking at the data and
examining two variables: laboratory performance ("involved in no incident", "involved in exactly one incident", or "involved in 2+ incidents") and status
regarding lab techniques course ("took the techniques course" or "didn't take the techniques course").
The contingency table below gives a summary of the data that have been gathered so far. In each of the 6 cells of the table are three numbers: the first
number is the observed cell frequency (f); the second number is the expected cell frequency (f) under the assumption that there is no relationship between
students' laboratory performances and whether or not they took the techniques course; and the third number is the following value.
(fo-ƒE)²
fE
The numbers labeled "Total" are totals for observed frequency.
Part 1
(Observed cell frequency - Expected cell frequency)²
Expected cell frequency
Fill in the missing values in the contingency table. Round your expected frequencies to two or more decimal places, and round your
three or more decimal places.
(fo-fe)²
JE
values to
Expert Solution
This question has been solved!
Explore an expertly crafted, step-by-step solution for a thorough understanding of key concepts.

This is a popular solution!

Trending now
This is a popular solution!

Step by step
Solved in 2 steps with 2 images

Recommended textbooks for you