Would you favor spending more federal tax money on the arts? Of a random sample of n1 = 87 politically conservative voters, r1 = 19 responded yes. Another random sample of n2 = 77 politically moderate voters showed that r2 = 21 responded yes. Does this information indicate that the population proportion of conservative voters inclined to spend more federal tax money on funding the arts is less than the proportion of moderate voters so inclined? Use ? = 0.05. I need help with finding the P-vaue and (b) What sampling distribution will you use? What assumptions are you making?
Would you favor spending more federal tax money on the arts? Of a random sample of n1 = 87 politically conservative voters, r1 = 19 responded yes. Another random sample of n2 = 77 politically moderate voters showed that r2 = 21 responded yes. Does this information indicate that the population proportion of conservative voters inclined to spend more federal tax money on funding the arts is less than the proportion of moderate voters so inclined? Use ? = 0.05. I need help with finding the P-vaue and (b) What sampling distribution will you use? What assumptions are you making?

Holt Mcdougal Larson Pre-algebra: Student Edition 2012
1st Edition
ISBN:9780547587776
Author:HOLT MCDOUGAL
Publisher:HOLT MCDOUGAL
Chapter11: Data Analysis And Probability
Section11.4: Collecting Data
Problem 2E

Related questions

Question
Would you favor spending more federal tax money on the arts? Of a random sample of n1 = 87 politically conservative voters, r1 = 19 responded yes. Another random sample of n2 = 77 politically moderate voters showed that r2 = 21 responded yes. Does this information indicate that the population proportion of conservative voters inclined to spend more federal tax money on funding the arts is less than the proportion of moderate voters so inclined? Use ? = 0.05.
I need help with finding the P-vaue and (b) What sampling distribution will you use? What assumptions are you making?
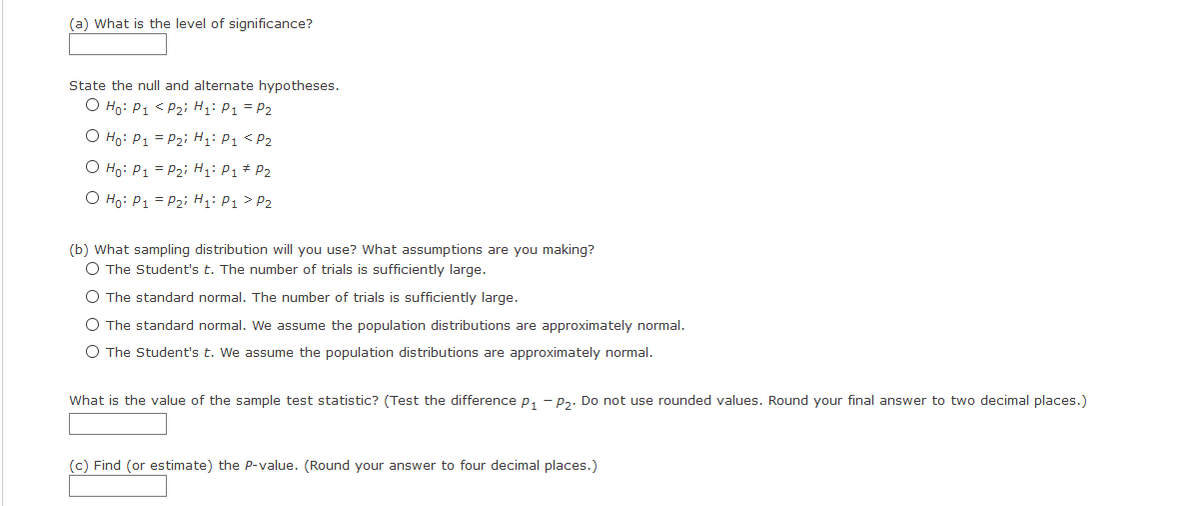
Transcribed Image Text:(a) What is the level of significance?
State the null and alternate hypotheses.
O Ho: P1 < P2i H1: P1 = P2
O Ho: P1 = P2i Hi: P1 < P2
O Ho: P1 = P2i H: P1* P2
O Ho: P1 = P2i H1: P1 > P2
(b) What sampling distribution will you use? What assumptions are you making?
O The Student's t. The number of trials is sufficiently large.
O The standard normal. The number of trials is sufficiently large.
O The standard normal. We assume the population distributions are approximately normal.
O The Student's t. We assume the population distributions are approximately normal.
What is the value of the sample test statistic? (Test the difference p, - P2. Do not use rounded values. Round your final answer to two decimal places.)
(c) Find (or estimate) the P-value. (Round your answer to four decimal places.)
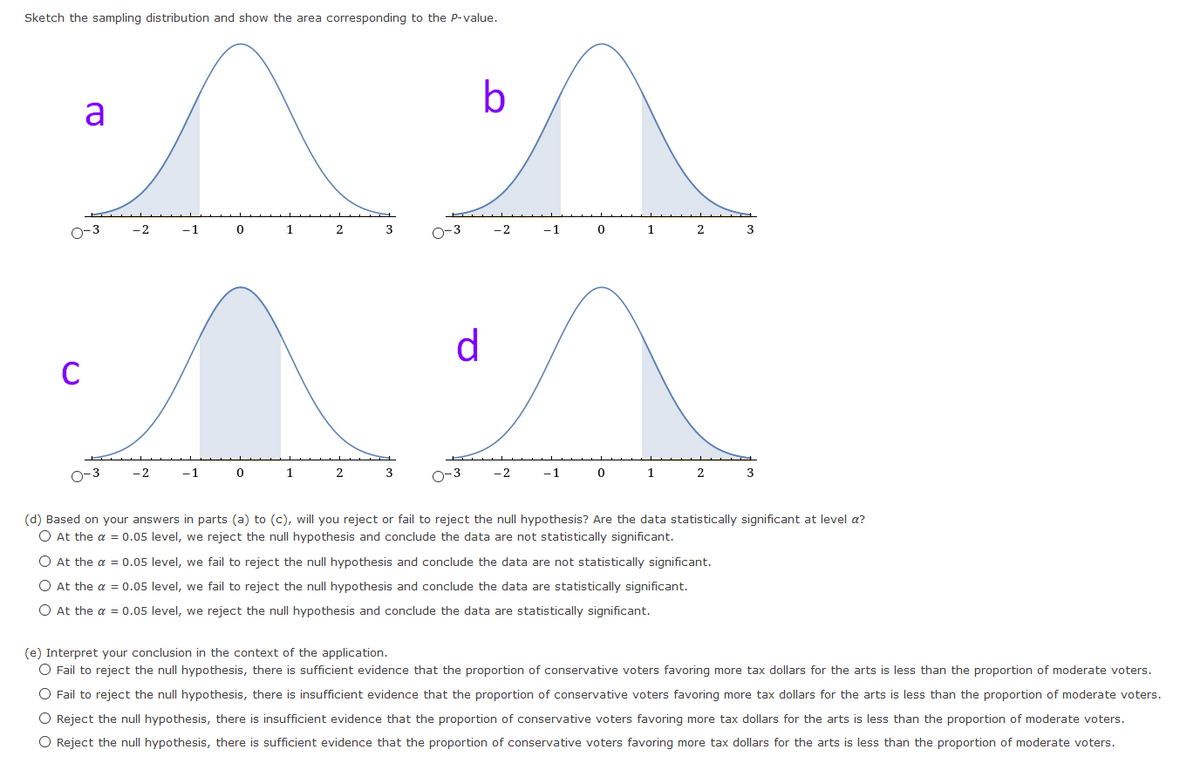
Transcribed Image Text:Sketch the sampling distribution and show the area corresponding to the P-value.
b
a
O-3
-2
-1
1.
2
3
O-3
-2
-1
1
2
3
d.
O-3
-2
-1
1
2
3
O-3
-2
-1
1
2
3
(d) Based on your answers in parts (a) to (c), will you reject or fail to reject the null hypothesis? Are the data statistically significant at level a?
O At the a = 0.05 level, we reject the null hypothesis and conclude the data are not statistically significant.
O At the a = 0.05 level, we fail to reject the null hypothesis and conclude the data are not statistically significant.
O At the a = 0.05 level, we fail to reject the null hypothesis and conclude the data are statistically significant.
O At the a = 0.05 level, we reject the null hypothesis and conclude the data are statistically significant.
(e) Interpret your conclusion in the context of the application.
O Fail to reject the null hypothesis, there is sufficient evidence that the proportion of conservative voters favoring more tax dollars for the arts is less than the proportion of moderate voters.
O Fail to reject the null hypothesis, there is insufficient evidence that the proportion of conservative voters favoring more tax dollars for the arts is less than the proportion of moderate voters.
O Reject the null hypothesis, there is insufficient evidence that the proportion of conservative voters favoring more tax dollars for the arts is less than the proportion of moderate voters.
O Reject the null hypothesis, there is sufficient evidence that the proportion of conservative voters favoring more tax dollars for the arts is less than the proportion of moderate voters.
Expert Solution
This question has been solved!
Explore an expertly crafted, step-by-step solution for a thorough understanding of key concepts.

Step by step
Solved in 4 steps

Knowledge Booster


Learn more about
Need a deep-dive on the concept behind this application? Look no further. Learn more about this topic, statistics and related others by exploring similar questions and additional content below.Recommended textbooks for you
Holt Mcdougal Larson Pre-algebra: Student Edition…
Algebra
ISBN:
9780547587776
Author:
HOLT MCDOUGAL
Publisher:
HOLT MCDOUGAL

College Algebra (MindTap Course List)
Algebra
ISBN:
9781305652231
Author:
R. David Gustafson, Jeff Hughes
Publisher:
Cengage Learning
Holt Mcdougal Larson Pre-algebra: Student Edition…
Algebra
ISBN:
9780547587776
Author:
HOLT MCDOUGAL
Publisher:
HOLT MCDOUGAL
College Algebra (MindTap Course List)
Algebra
ISBN:
9781305652231
Author:
R. David Gustafson, Jeff Hughes
Publisher:
Cengage Learning