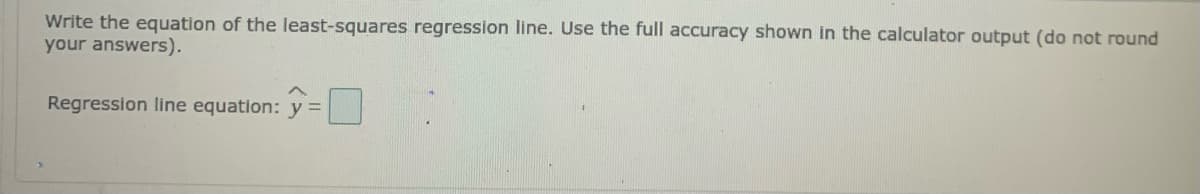
Write the equation of the least-squares regression line. Use the full accuracy shown in the calculator output (do not round your answers). Regression line equation: y =
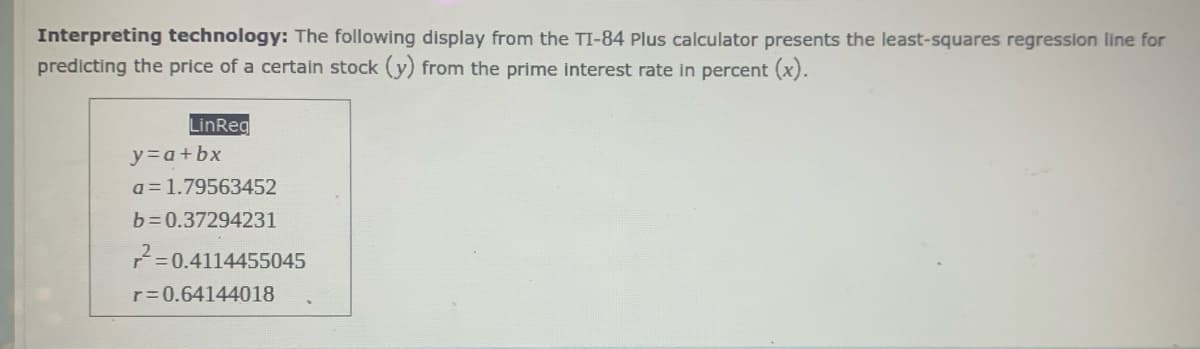
Q: 2. The frequency of heavy rains in one week follows a Poisson distribution with parameter A. Accordi...
A: a) The Poisson pmf given λ is given by, P(X=x)=e-λλxx!, x=0,1,2,...... where λ>0. The joint pmf f...
Q: Customers aTive at a shopping mall by bus, or in their own cars, or by taxi, in the relative quantit...
A:
Q: Blood pressure in men: The three quartiles for systolic blood pressure in a sample of 3184 men were ...
A:
Q: The probability that a person living in a certain city owns a dog is estimated to be 0.5. Find the p...
A:
Q: 3. The following questions ask you to submit a short response to the question (if you find yourself ...
A: The mean of a probability distribution tells about the central tendency while the variance measures ...
Q: The table below shows the probability distribution for X, where X represents the number of intercept...
A:
Q: Nuclear power: The following table presents the number of nuclear reactors as of August 2, 2013, In ...
A: Mean, Median and Mode are measures of central tendency.
Q: Suppose that the marketing team of a fast-food restaurant wants to have an idea of the effectivity o...
A: Given data is x 20 40 60 80 100 120 P(x) 0.04 a 0.21 0.27 0.25 0.14
Q: lillustrations 5. (b) The mean of 200 items was 50. Later on it was discovered that two items were M...
A:
Q: Which graphic representation could a researcher use to help determine if a continuous variable follo...
A: The answer is Histogram. Histogram is a graphical representation that indicates the distribution of ...
Q: 6. To answer the objective of the study, Lilliefors used different data collection methods. First, s...
A: Given the data collection methods in two researches.
Q: A consumer group claims that the mean minimum time it takes for a sedan to travel a quarter mile is ...
A: Given that x̄ = 15.5 μ = 14.8 s = 2.09 n = 22 Note: According to bartleby experts question answers ...
Q: Quarters are now manufactured so that they have a mean weight of 5.670 g and a standard deviation of...
A:
Q: P/Example 8-14. Show that the rth moment µ,' about the origin of the binomial ... (*) distribution o...
A:
Q: Suppose that the amount of time that students spend studying in the library in one sitting is normal...
A:
Q: Need asap. A magazine article conducted a survey of 1000 people in Washington State and found that ...
A:
Q: The average height of a large group of children is 43 inches, and the SD is 1.2 inches. The average ...
A:
Q: Interpreting technology: The following display from the TI-84 Plus calculator presents the least-squ...
A: Given The output from TI-84 Plus calculator for the least square regression line is as follows:
Q: 3 P(A and B) 10 27 find P(A) 200 Р (В) 2 Р (А аnd B) 5 3 find P(B) = 10 P(A) = P(B) = 0.25, P(A and ...
A: GivenP(B)=310P(A and B)=27200
Q: Scores of an achievement test show that it fallows a normal distribution. Its mean is 78 with standa...
A:
Q: if x<-2 (++2)if-2sx<o F(x)= 4 (2+1) if 0sx<1 if x21 Determine the expected value of X. OA 1/3
A:
Q: Let’s consider whether U.S. college football teams differ in the likelihood of being mismatched in t...
A:
Q: The average time to run the 5K fun run is 24 minutes and the standard deviation is 2.6 minutes. 8 ru...
A: As per guidelines expert have to answer first question three subparts only dear student please uploa...
Q: Given the following information, calculate the pooled sample variance that should be used in the poo...
A:
Q: From the following data of the marks obtaincd by 60 students of a class, calculate the arıthmetic me...
A:
Q: For a hypothesis test comparing two Independent population means, the combined degrees of freedom ar...
A: given: hypothesis testing of comparison between two population mean and population standard deviati...
Q: Null and Alternative Hypothesis In Words a. Hg:The average birth weight of the population is 8.6 One...
A: GivenThe average score of 50 high school varsity is less than 88
Q: The amount of pollutants that are found in waterways near large cities is normally distributed with ...
A: As per our guidelines we are suppose to answer three sub parts. Given,sample size(n)=10mean(μ)=8.5st...
Q: A random sample of 87 eighth grade students' scores on a national mathematics assessment test has a...
A:
Q: Calculate a point estimate of the population correlation coefficient between Cl AMIA and Co AMIA ...
A: Given: Subj Clockwise(Cl) Counterclockwise(Co) 1 57.9 43.2 2 35.7 52.1 3 54.5 59.2 4 56.8...
Q: For items 1-2, consider the following: The members of Math Club are to choose a representative among...
A: Given Information: Number of votes 18 12 5 3 2 2 First choice H T M A H T Second choice M A T...
Q: 3. The universe of the study is O A. the set of all residents in NCR O B. the set of all Covid-19 pa...
A: The universe of the study is
Q: Durations of clinical research studies awarded by a particular federal agency are assumed to follow ...
A:
Q: 54. If the aim of the study is to determine the occurrence of dengue cases among school children age...
A: 54. The aim of the the study is to determine the occurrence of dengue cases among school children ag...
Q: 4. Variables M and N are O A. both qualitative R-keth
A: Solution: The variables can be classified into two types. 1) Qualitative variable and 2) Quantitat...
Q: Illustration 5. Classify the following data by taking class interval such that their mid values are ...
A:
Q: A famous artist wishes to insure his dog for half a million pesos. The insurance company estimates t...
A:
Q: Which of the following illustrates statistics in a singular sense? You may pick only one, both, or n...
A: Given that, two statements: Statistics on the number of confirmed COVID-19 positive cases show that...
Q: 2. Suppose the following are the number of times a student looks at their phone while the professor ...
A: Given : Obs. (X) 4 5 6 8 1 2 4 4 3
Q: 28. An exit poll of 300 persons showed that candidate A received 53 % of the vote in a given precinc...
A:
Q: Indicate the type of hypothesus each of the following are by indicating directional or non-direction...
A: Null and alternative hypotheses: Null hypothesis: The null hypothesis is a statement that indicates ...
Q: Find means of X and Y and correlation coefficient.
A: Here given two equations of lines
Q: The following data is representative of that reported in an article on nitrogen emissions, with x = ...
A:
Q: A box contains 5 balls. Two are numbered 3, one is numbered 4, and two are numbered 5. The balls are...
A:
Q: For the Central Limit Theorem, the idea is that the more values within your data set, the more the d...
A: We are given below Histogram.
Q: Let’s consider whether U.S. college football teams differ in the likelihood of being mismatched in t...
A: Introduction: Denote μ as the true mean spread in the lower league games in the given season.
Q: 7. Which of the following is(are) TRUE about the data set? I. The number of mayas deviates from its ...
A: Given: VARIABLE STANDARD DEVIATION SKEWNESS CV MAYAS 77.12 0.21 60.91 PEDESTRIANS 9.78 0.70 6...
Q: the average length of time for students to register for classes at a certain college has been 110 mi...
A: Given,sample size(n)=20sample mean(x¯)=90standard deviation(s)=14.5degrees of freedom(df)=n-1df=20-1...
Q: Write the equation of the least-squares regression line. Use the full accuracy shown in the MINITAB ...
A: Least square regression line is the line which best fits the linear relationship between two variabl...
Q: An article gave a scatter plot along with the least squares line of x = rainfall volume (m3) and y =...
A:
Trending now
This is a popular solution!
Step by step
Solved in 2 steps
- A box office analyst seeks to predict opening weekend box office gross for movies. Toward this goal, the analyst plans to use online trailer views as a predictor. For each of the 66 movies, the number of online trailer views from the release of the trailer through the Saturday before a movie opens and the opening weekend box office gross (in millions of dollars) are collected and stored in the accompanying table. The least-squares regression equation for these data is Yi=−1.068+1.394Xi and the standard error of the estimate is SYX=19.412. Assume that the straight-line model is appropriate and there are no serious violations the assumptions of the least-squares regression model. Significance level at 0.05 . Complete parts (a) and (b) below.A box office analyst seeks to predict opening weekend box office gross for movies. Toward this goal, the analyst plans to use online trailer views as a predictor. For each of the 66 movies, the number of online trailer views from the release of the trailer through the Saturday before a movie opens and the opening weekend box office gross (in millions of dollars) are collected and stored in the accompanying table. The least-squares regression equation for these data is Yi=−1.606+1.428Xi and the standard error of the estimate is SYX=19.348. Assume that the straight-line model is appropriate and there are no serious violations the assumptions of the least-squares regression model. Complete parts (a) and (b) below. a. At the 0.01 level of significance, is there evidence of a linear relationship between online trailer views and opening weekend box office gross? Determine the hypotheses for the test. b. Construct a 95%confidence interval estimate of the population…At Hard Rock’s Moscow restaurant, the manager is trying to evaluate how a new advertising campaign affects guest counts. Using data for the past 10 months (see the table), develop a least-squares regression relationship and then forecast the expected guest count when advertising is $65,000.
- A box office analyst seeks to predict opening weekend box office gross for movies. Toward this goal, the analyst plans to use online trailer views as a predictor. For each of the 66 movies, the number of online trailer views from the release of the trailer through the Saturday before a movie opens and the opening weekend box office gross (in millions of dollars) are collected and stored in the accompanying table. The least-squares regression equation for these data isYi=−0.914+1.408Xi and the standard error of the estimate is SYX=19.887. Assume that the straight-line model is appropriate and there are no serious violations the assumptions of the least-squares regression model. Compute the test statistic.A box office analyst seeks to predict opening weekend box office gross for movies. Toward this goal, the analyst plans to use online trailer views as a predictor. For each of the 66 movies, the number of online trailer views from the release of the trailer through the Saturday before a movie opens and the opening weekend box office gross (in millions of dollars) are collected and stored in the accompanying table. The least-squares regression equation for these data is Yi=−1.660+1.417Xi and the standard error of the estimate is SYX=19.349. Assume that the straight-line model is appropriate and there are no serious violations the assumptions of the least-squares regression model.A magazine publishes restaurant ratings for various locations around the world. The magazine rates the restaurants for food, decor, service, and the cost per person. Develop a regression model to predict the cost per person, based on a variable that represents the sum of the three ratings. The magazine has compiled the accompanying table of this summated ratings variable and the cost per person for 25 restaurants in a major city. Assuming a linear relationship, use the least-squares method to compute the regression coefficients b0 and b1.