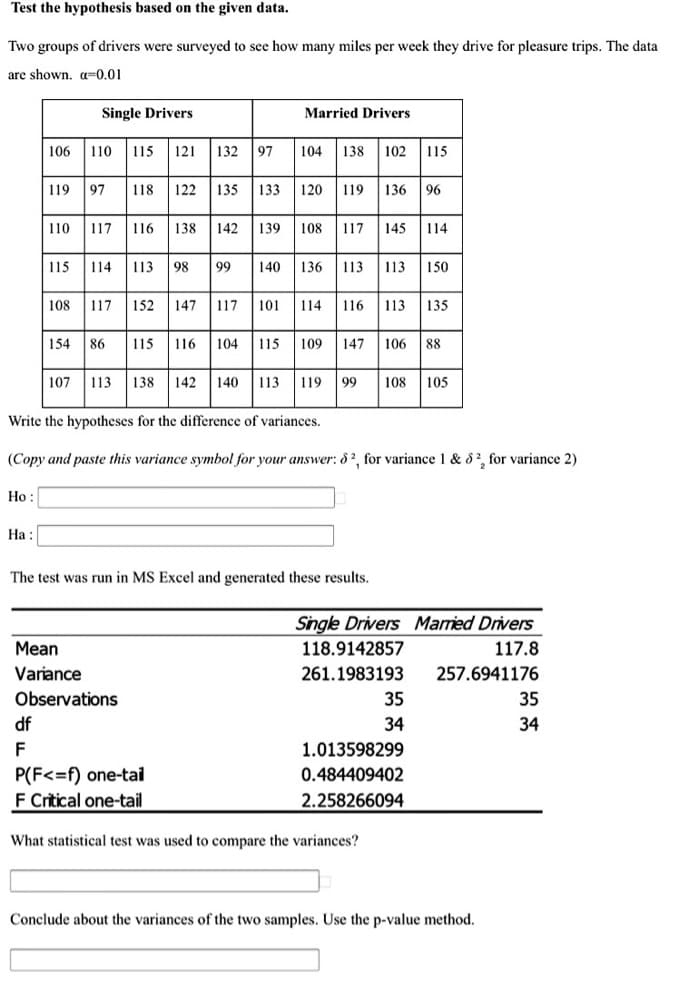
Write the hypotheses for the difference of variances. (Copy and paste this variance symbol for your answer: &2, for variance 1 & 8, for variance 2) Но: На: The test was run in MS Excel and generated these results. Single Drivers Married Drivers Mean 118.9142857 117.8 Variance 261.1983193 257.6941176 Observations 35 35 df 34 34 F 1.013598299 P(F<=f) one-tai 0.484409402 F Critical one-tail 2.258266094 What statistical test was used to compare the variances? Conclude about the variances of the two samples. Use the p-value method.
Write the hypotheses for the difference of variances. (Copy and paste this variance symbol for your answer: &2, for variance 1 & 8, for variance 2) Но: На: The test was run in MS Excel and generated these results. Single Drivers Married Drivers Mean 118.9142857 117.8 Variance 261.1983193 257.6941176 Observations 35 35 df 34 34 F 1.013598299 P(F<=f) one-tai 0.484409402 F Critical one-tail 2.258266094 What statistical test was used to compare the variances? Conclude about the variances of the two samples. Use the p-value method.
Glencoe Algebra 1, Student Edition, 9780079039897, 0079039898, 2018
18th Edition
ISBN:9780079039897
Author:Carter
Publisher:Carter
Chapter10: Statistics
Section10.6: Summarizing Categorical Data
Problem 4BGP
Related questions
Question

Transcribed Image Text:Test the hypothesis based on the given data.
Two groups of drivers were surveyed to see how many miles per week they drive for pleasure trips. The data
are shown, a=0.01
Single Drivers
Married Drivers
106 110 115 121 132 97
102 115
104
138
| 119 97
118 122 135
133
120
119
136 96
110 117 116 138 142 139 108 117 145 114
| 115
114 113 98 99 140 136 113 113
150
108 117 152 147 117 101 114 116 113 135
154 86
115 116 104 115 109 147 106 88
107
113 138 142
140
113
119
99
108
105
Write the hypotheses for the difference of variances.
(Copy and paste this variance symbol for your answer: 8², for variance 1 & 8?, for variance 2)
Ho :
На:
The test was run in MS Excel and generated these results.
Single Drivers Maried Drivers
Mean
118.9142857
117.8
Variance
261.1983193
257.6941176
Observations
35
35
df
34
34
F
1.013598299
P(F<=f) one-tai
F Critical one-tail
0.484409402
2.258266094
What statistical test was used to compare the variances?
Conclude about the variances of the two samples. Use the p-value method.
Expert Solution
This question has been solved!
Explore an expertly crafted, step-by-step solution for a thorough understanding of key concepts.
Step by step
Solved in 2 steps

Recommended textbooks for you

Glencoe Algebra 1, Student Edition, 9780079039897…
Algebra
ISBN:
9780079039897
Author:
Carter
Publisher:
McGraw Hill

Glencoe Algebra 1, Student Edition, 9780079039897…
Algebra
ISBN:
9780079039897
Author:
Carter
Publisher:
McGraw Hill