X and R control charts have been implemented for a critical quality characteristic of a product. The sample size used is six units. After collecting 30 process samples for this product, the means and deviations of these samples were calculated. The mean
X and R control charts have been implemented for a critical quality characteristic of a product. The sample size used is six units. After collecting 30 process samples for this product, the means and deviations of these samples were calculated. The mean

Algebra & Trigonometry with Analytic Geometry
13th Edition
ISBN:9781133382119
Author:Swokowski
Publisher:Swokowski
Chapter5: Inverse, Exponential, And Logarithmic Functions
Section5.4: Logarithmic Functions
Problem 33E

Related questions
Question
X and R control charts have been implemented for a critical quality characteristic of a product.
The
means and deviations of these samples were calculated.
The means and variances of these samples were calculated and the following was found:
(image)
a) Find the three sigma control limits for this plot.
Assume later that the process is statistically controlled.
b) If a special cause causes the process mean to change to 199, what is the probability of
detecting that change in the first sample taken after the change occurs? In the third sample?
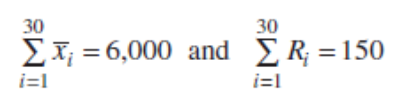
Transcribed Image Text:30
30
ΣΣ-6,000 and ΣR = 150
%3D
i=1
i=1
Expert Solution
This question has been solved!
Explore an expertly crafted, step-by-step solution for a thorough understanding of key concepts.

Step by step
Solved in 3 steps

Recommended textbooks for you
Algebra & Trigonometry with Analytic Geometry
Algebra
ISBN:
9781133382119
Author:
Swokowski
Publisher:
Cengage

College Algebra (MindTap Course List)
Algebra
ISBN:
9781305652231
Author:
R. David Gustafson, Jeff Hughes
Publisher:
Cengage Learning

Algebra & Trigonometry with Analytic Geometry
Algebra
ISBN:
9781133382119
Author:
Swokowski
Publisher:
Cengage
College Algebra (MindTap Course List)
Algebra
ISBN:
9781305652231
Author:
R. David Gustafson, Jeff Hughes
Publisher:
Cengage Learning

Trigonometry (MindTap Course List)
Trigonometry
ISBN:
9781337278461
Author:
Ron Larson
Publisher:
Cengage Learning