西☆ * X (total number of jobs (in hundreds)) x (total number of jobs 30 35 40 45 x (total number of jobs (in hundreds) x (total number of jobs (in hundreds)) y (number of entry-level jobs (in hundreds)) y (number of entry-level jobs i y (number of entry-level jobs (in hundreds)) y(number of entry-level jobs
西☆ * X (total number of jobs (in hundreds)) x (total number of jobs 30 35 40 45 x (total number of jobs (in hundreds) x (total number of jobs (in hundreds)) y (number of entry-level jobs (in hundreds)) y (number of entry-level jobs i y (number of entry-level jobs (in hundreds)) y(number of entry-level jobs

Linear Algebra: A Modern Introduction
4th Edition
ISBN:9781285463247
Author:David Poole
Publisher:David Poole
Chapter7: Distance And Approximation
Section7.3: Least Squares Approximation
Problem 31EQ

Related questions
Question
An economist is studying the job market in Denver area neighborhoods. Let x represent the total number of jobs in a given neighborhood, and let y represent the number of entry-level jobs in the same neighborhood. A sample of six Denver neighborhoods gave the following information (units in hundreds of jobs).
| x | 17 | 30 | 52 | 28 | 50 | 25 |
|---|---|---|---|---|---|---|
| y | 2 | 3 | 7 | 5 | 9 | 3 |
Complete parts (a) through (e), given Σx = 202, Σy = 29, Σx2 = 7802, Σy2 = 177, Σxy = 1153, and r ≈ 0.9199.
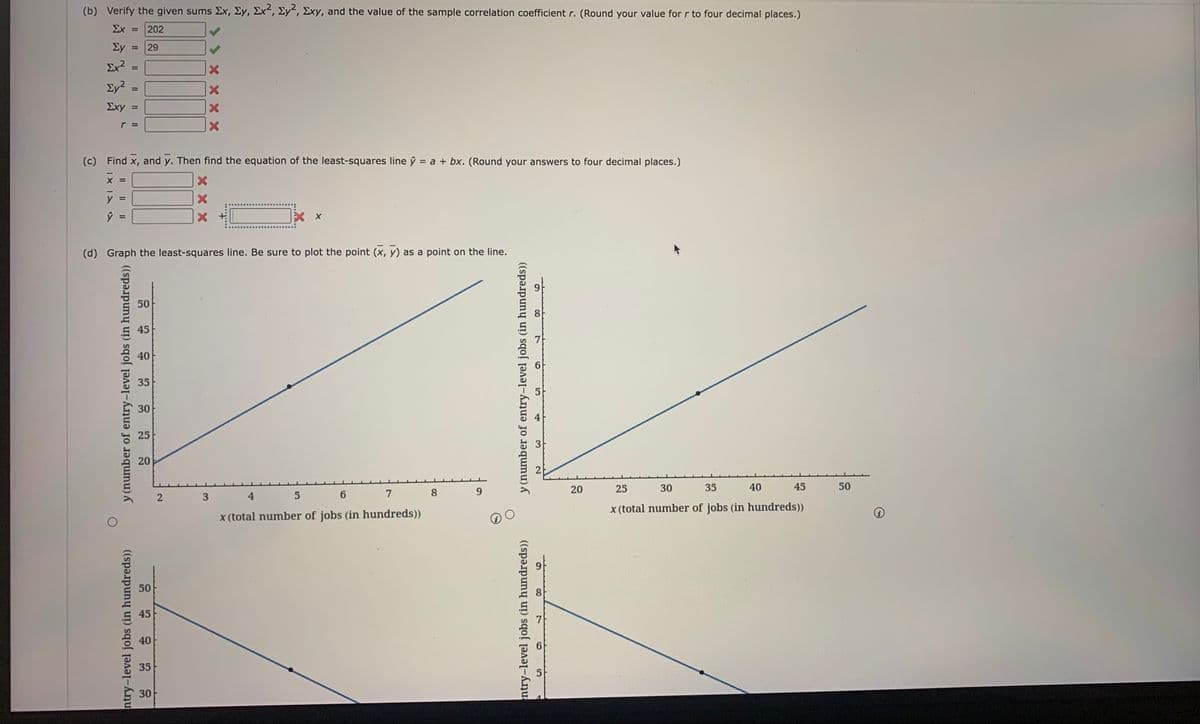
Transcribed Image Text:(b) Verify the given sums Ex, Ey, Ex, Ey, Exy, and the value of the sample correlation coefficient r. (Round your value for r to four decimal places.)
Ex =
202
Ey
29
%3D
Ex?
%D
Ey2
%3D
Exy
%3D
(c) Find x, and y. Then find the equation of the least-squares line ŷ = a + bx. (Round your answers to four decimal places.)
X =
%3D
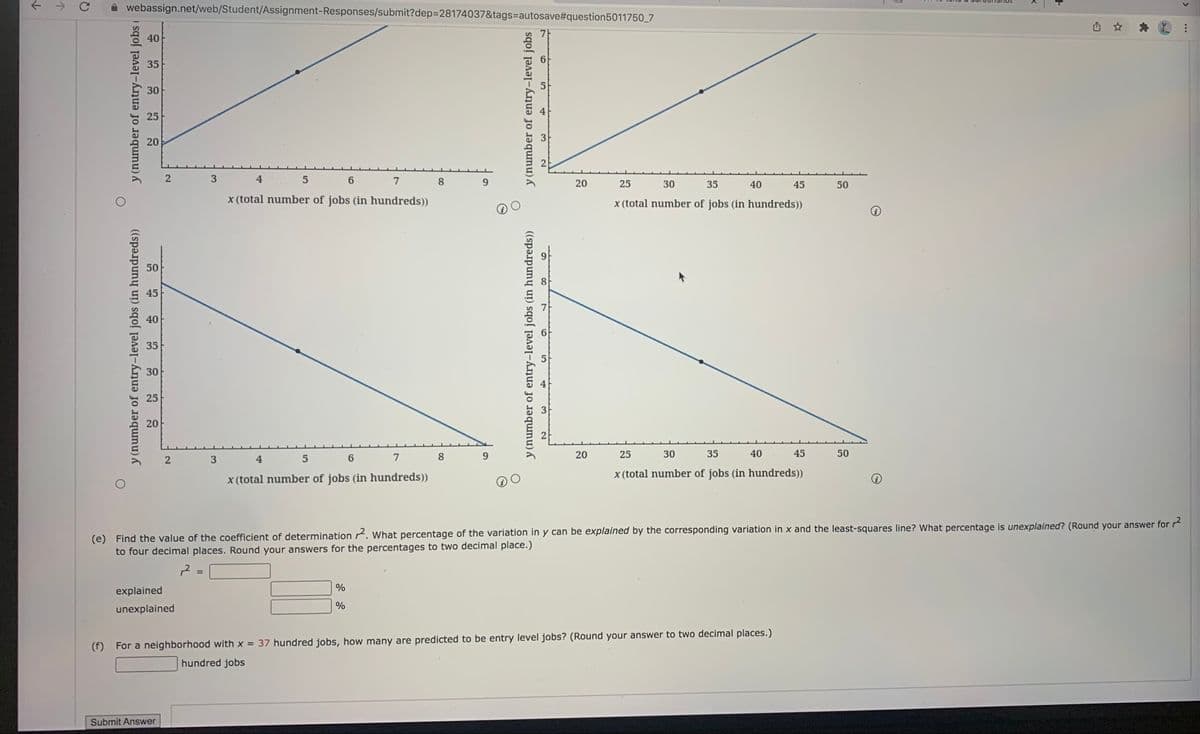
(d) Graph the least-squares line. Be sure to plot the point (x, y) as a point on the line.
50
8
45
7
40
35
5
30
25
20
20
25
30
35
40
45
50
3 4
7
x (total number of jobs (in hundreds))
x (total number of jobs (in hundreds))
50
45
40
35
3.
y (number of entry-level jobs (in hundreds))
ntry-level jobs (in hundreds))
CO
X X x X
2.
30
II
II
y (number of entry-level jobs (in hundreds))
ntry-level jobs (in hundreds))
Transcribed Image Text:webassign.net/web/Student/Assignment-Responses/submit?dep=28174037&tags=autosave#question5011750_7
40
35
30
25
20
3
4 5
7
9.
25
30
35
40
45
50
x (total number of jobs (in hundreds))
x (total number of jobs (in hundreds))
50
45
40
35
30
25
20
6
20
25
30
35
40
45
50
3 4 5
7
8
9.
x (total number of jobs (in hundreds))
x (total number of jobs (in hundreds))
(e) Find the value of the coefficient of determination r. What percentage of the variation in y can be explained by the corresponding variation in x and the least-squares line? What percentage is unexplained? (Round your answer for r
to four decimal places. Round your answers for the percentages to two decimal place.)
12
%3D
%
explained
%
unexplained
(f)
For a neighborhood with x = 37 hundred jobs, how many are predicted to be entry level jobs? (Round your answer to two decimal places.)
hundred jobs
Submit Answer
>
...
+
20
2.
3.
y (number of entry-level jobs (in hundreds))
y (number of entry-level jobs
2.
y (number of entry-level jobs (in hundreds))
y (number of entry-level jobs (
Expert Solution
This question has been solved!
Explore an expertly crafted, step-by-step solution for a thorough understanding of key concepts.

Step by step
Solved in 4 steps with 5 images

Recommended textbooks for you
Linear Algebra: A Modern Introduction
Algebra
ISBN:
9781285463247
Author:
David Poole
Publisher:
Cengage Learning

Elementary Linear Algebra (MindTap Course List)
Algebra
ISBN:
9781305658004
Author:
Ron Larson
Publisher:
Cengage Learning

Glencoe Algebra 1, Student Edition, 9780079039897…
Algebra
ISBN:
9780079039897
Author:
Carter
Publisher:
McGraw Hill
Linear Algebra: A Modern Introduction
Algebra
ISBN:
9781285463247
Author:
David Poole
Publisher:
Cengage Learning
Elementary Linear Algebra (MindTap Course List)
Algebra
ISBN:
9781305658004
Author:
Ron Larson
Publisher:
Cengage Learning
Glencoe Algebra 1, Student Edition, 9780079039897…
Algebra
ISBN:
9780079039897
Author:
Carter
Publisher:
McGraw Hill