Let XB and XA denote, respectively, the weight of a person before and after a certain weight loss diet regime. If D = XA- XB, then the mean of the differences, D, calculated on a random sample of size n, can be used as a basis to test Ho: µD = 0 against H1: µD > 0 and thus verify if the weight loss diet has been effective. A t-test statistic is usually built as the ratio of an estimator of the population parameter of interest (or a function of the population parameters of interest in the case of the difference of two means), divided by its standard error. A significant treatment-by-block interaction in the ANOVA for an RCBD with more than one replicate per treatment per block indicates that differences among treatments are not constant from block to block.
Let XB and XA denote, respectively, the weight of a person before and after a certain weight loss diet regime. If D = XA- XB, then the mean of the differences, D, calculated on a random sample of size n, can be used as a basis to test Ho: µD = 0 against H1: µD > 0 and thus verify if the weight loss diet has been effective. A t-test statistic is usually built as the ratio of an estimator of the population parameter of interest (or a function of the population parameters of interest in the case of the difference of two means), divided by its standard error. A significant treatment-by-block interaction in the ANOVA for an RCBD with more than one replicate per treatment per block indicates that differences among treatments are not constant from block to block.

Algebra & Trigonometry with Analytic Geometry
13th Edition
ISBN:9781133382119
Author:Swokowski
Publisher:Swokowski
Chapter10: Sequences, Series, And Probability
Section10.8: Probability
Problem 32E

Related questions

Question
Transcribed Image Text:7)
T F
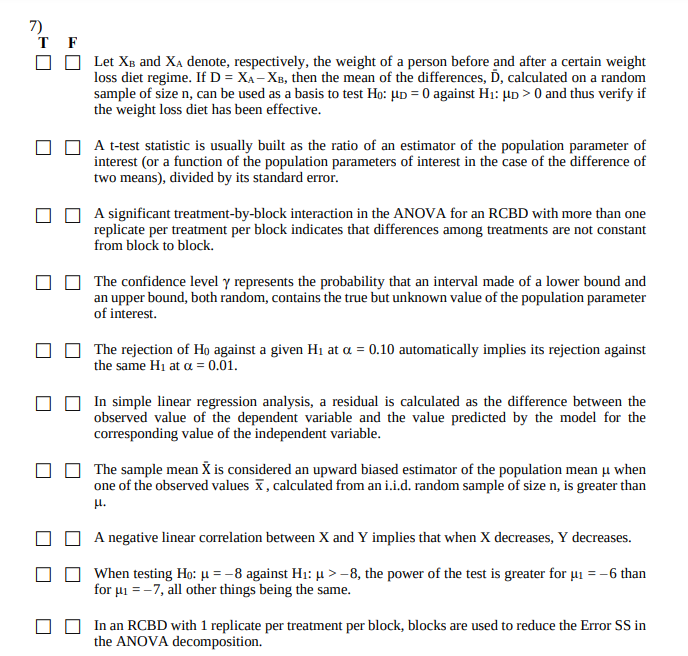
Let XB and XẠ denote, respectively, the weight of a person before and after a certain weight
loss diet regime. If D = XA- XB, then the mean of the differences, D, calculated on a random
sample of size n, can be used as a basis to test Ho: µD = 0 against H1: µD > 0 and thus verify if
the weight loss diet has been effective.
A t-test statistic is usually built as the ratio of an estimator of the population parameter of
interest (or a function of the population parameters of interest in the case of the difference of
two means), divided by its standard error.
A significant treatment-by-block interaction in the ANOVA for an RCBD with more than one
replicate per treatment per block indicates that differences among treatments are not constant
from block to block.
The confidence level y represents the probability that an interval made of a lower bound and
an upper bound, both random, contains the true but unknown value of the population parameter
of interest.
The rejection of Ho against a given H1 at a = 0.10 automatically implies its rejection against
the same H1 at a = 0.01.
In simple linear regression analysis, a residual is calculated as the difference between the
observed value of the dependent variable and the value predicted by the model for the
corresponding value of the independent variable.
The sample mean X is considered an upward biased estimator of the population mean µ when
one of the observed values x, calculated from an i.i.d. random sample of size n, is greater than
H.
A negative linear correlation between X and Y implies that when X decreases, Y decreases.
When testing Ho: u = -8 against H1: u >-8, the power of the test is greater for u1 = -6 than
for µi = -7, all other things being the same.
In an RCBD with 1 replicate per treatment per block, blocks are used to reduce the Error SS in
the ANOVA decomposition.
Expert Solution
This question has been solved!
Explore an expertly crafted, step-by-step solution for a thorough understanding of key concepts.

This is a popular solution!

Trending now
This is a popular solution!

Step by step
Solved in 3 steps with 4 images

Knowledge Booster


Learn more about
Need a deep-dive on the concept behind this application? Look no further. Learn more about this topic, statistics and related others by exploring similar questions and additional content below.Recommended textbooks for you
Algebra & Trigonometry with Analytic Geometry
Algebra
ISBN:
9781133382119
Author:
Swokowski
Publisher:
Cengage
Algebra & Trigonometry with Analytic Geometry
Algebra
ISBN:
9781133382119
Author:
Swokowski
Publisher:
Cengage