The relationship between yield of maize (a type of corn), date of planting, and planting density was investigated in an article. Let the variables be defined as follows. y = maize yield (percent) X₁ = planting date (days after April 20) X₂= planting density (10,000 plants/ha) The following regression model with both quadratic terms where x3 = x₁² and x4 = x₂² provides a good description of the relationship between y and the independent variables. y = a + B₁x₁ + B₂X₂ + B3X3 + B4X4 + e (a) If a = 21.06, B₁ = 0.651, B₂ = 0.0023, 3 = -0.0205, and 4 = 0.3, what is the population regression function? y = (b) Use the regression function in part (a) to determine the mean yield (in percent) for a plot planted on May 7 with a density of 41,184 plants/ha. (Round your answer to two decimal places.) %
The relationship between yield of maize (a type of corn), date of planting, and planting density was investigated in an article. Let the variables be defined as follows. y = maize yield (percent) X₁ = planting date (days after April 20) X₂= planting density (10,000 plants/ha) The following regression model with both quadratic terms where x3 = x₁² and x4 = x₂² provides a good description of the relationship between y and the independent variables. y = a + B₁x₁ + B₂X₂ + B3X3 + B4X4 + e (a) If a = 21.06, B₁ = 0.651, B₂ = 0.0023, 3 = -0.0205, and 4 = 0.3, what is the population regression function? y = (b) Use the regression function in part (a) to determine the mean yield (in percent) for a plot planted on May 7 with a density of 41,184 plants/ha. (Round your answer to two decimal places.) %

Chapter4: Linear Functions
Section4.3: Fitting Linear Models To Data
Problem 34SE: For the following exercises, consider this scenario: The profit of a company decreased steadily...

Related questions
Question
a and b please
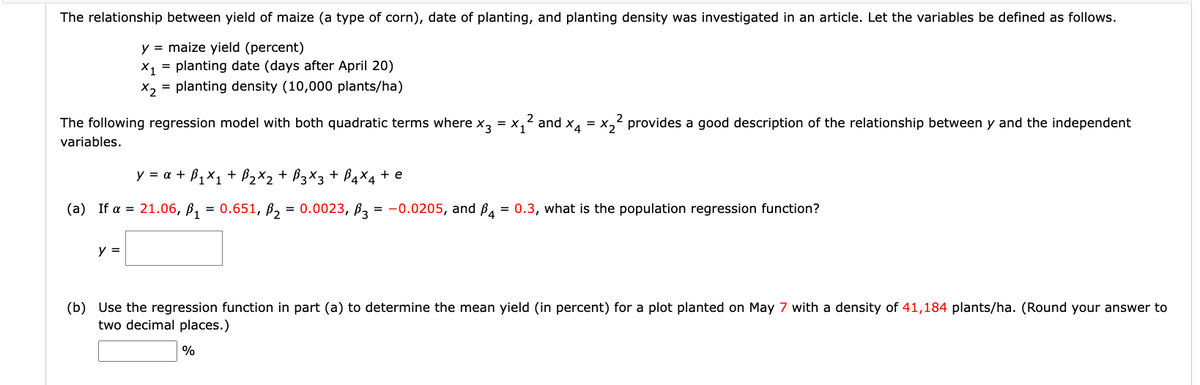
Transcribed Image Text:The relationship between yield of maize (a type of corn), date of planting, and planting density was investigated in an article. Let the variables be defined as follows.
y = maize yield (percent)
X₁ = planting date (days after April 20)
x₂ = planting density (10,000 plants/ha)
= x1
and x4 = x₂² provides a good description of the relationship between y and the independent
The following regression model with both quadratic terms where x3
variables.
y = α + B₁x₁ + B₂X₂ + B3X3 + B4X4 + e
(a) If a = 21.06, B₁ = 0.651, B₂ = 0.0023, 3 = -0.0205, and P4 = 0.3, what is the population regression function?
y =
(b) Use the regression function in part (a) to determine the mean yield (in percent) for a plot planted on May 7 with a density of 41,184 plants/ha. (Round your answer to
two decimal places.)
%
Expert Solution
This question has been solved!
Explore an expertly crafted, step-by-step solution for a thorough understanding of key concepts.

Step by step
Solved in 4 steps

Recommended textbooks for you

College Algebra
Algebra
ISBN:
9781305115545
Author:
James Stewart, Lothar Redlin, Saleem Watson
Publisher:
Cengage Learning

Functions and Change: A Modeling Approach to Coll…
Algebra
ISBN:
9781337111348
Author:
Bruce Crauder, Benny Evans, Alan Noell
Publisher:
Cengage Learning
College Algebra
Algebra
ISBN:
9781305115545
Author:
James Stewart, Lothar Redlin, Saleem Watson
Publisher:
Cengage Learning
Functions and Change: A Modeling Approach to Coll…
Algebra
ISBN:
9781337111348
Author:
Bruce Crauder, Benny Evans, Alan Noell
Publisher:
Cengage Learning

Trigonometry (MindTap Course List)
Trigonometry
ISBN:
9781305652224
Author:
Charles P. McKeague, Mark D. Turner
Publisher:
Cengage Learning

Algebra and Trigonometry (MindTap Course List)
Algebra
ISBN:
9781305071742
Author:
James Stewart, Lothar Redlin, Saleem Watson
Publisher:
Cengage Learning

Algebra & Trigonometry with Analytic Geometry
Algebra
ISBN:
9781133382119
Author:
Swokowski
Publisher:
Cengage