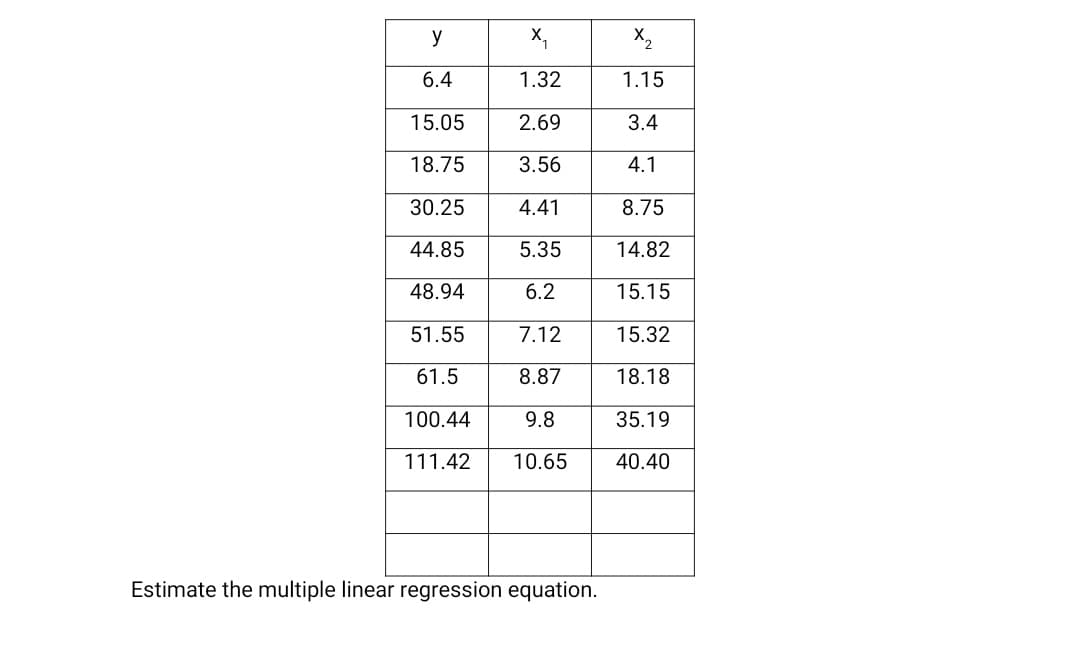
y X, X2 6.4 1.32 1.15 15.05 2.69 3.4 18.75 3.56 4.1 30.25 4.41 8.75 44.85 5.35 14.82 48.94 6.2 15.15 51.55 7.12 15.32 61.5 8.87 18.18 100.44 9.8 35.19 111.42 10.65 40.40 Estimate the multiple linear regression equation.


Q: A magazine claims that the mean amount spent by a customer at Burger Stop is greater than the mean…
A: GivenFor Burger stopx1=5.46s1=0.89n1=22For Fry Worldx2=5.12s2=0.79n2=30α=0.05
Q: A dentist is researching time spent teeth brushing. A sample of 13 brushing times is collected and…
A: Mean: The mean is the sum of observations divided by the number of observations. that is,Mean = x =…
Q: Consider the results of 3(b). Notice that all the data fit within the 99% confidence interval. Is…
A: Given data, 54,276 57,378 51,108 66,190 66,232 59,018 57,159 These data yield the following: ̄y =…
Q: Q1 A watch manufacturer claims that their watches on average will neither gain nor lose time during…
A: Followings are the Explanations of the question Calculate the Sample Mean and Sample Standard…
Q: Data of measures in liters are as follows: 4.56, 4.65, 4.66, 4.34, 4.65, 4.40, 4.50, 4.55, 4.69,…
A: "Since you have posted a question with multiple sub-parts, we will solve first three sub-parts for…
Q: A survey of 64 families yields the following data for the number of children per family. 2 2 0 1 1 2…
A:
Q: 35 - 65 e 24 /24F 91 99 110 91 144 176 80 86 124
A: “Since you have posted a question with multiple sub-parts, we will solve first three sub-parts for…
Q: What percent of the total population is found between the mean and the z-score? Z=0.31 Answer…
A:
Q: : Calculate the Median and Mode of the persons per house from the data.…
A: Given data: No. of persons per house 1 2 3 4 5 6 7 8 9 10 No. of houses 26 113 120 95 60 42 21…
Q: Calculate the 30th percentile of the data shown x 2.5 4.4 5.7 7 7.6 8.1 17.8 21.2 23.9 27.8…
A: The sorted values are, 2.5, 4.4, 5.7, 7, 7.6, 8.1, 17.8, 21.2, 23.9, 27.8 The number of observations…
Q: 3. Calculate 6th decile,Median, Mode & cofficent of variation from the following data. X 10.8 10.6…
A: Given, X f 10.8 16 10.6 29 10.4 45 10.2 54 10 69 9.8 74 9.6 53 9.4 49 9.2 74…
Q: Calculate the coefficient of variation of a distribution with == 25, *f=21 254 and 2.1= 3804 O…
A:
Q: The data table to the right represents the volumes of a generic soda brand. Next Question Volumes of…
A: Given that Volume of a generic soda brand. Volume Frequency 70 4 80…
Q: Find the variance in classified data set (k=5) Sınıflandırilmış veriterde varyansı bulunuz (k-5) 17…
A: Given data : 17, 20, ,23, 26, 28, 31, 37, 40, 40, 40, 40, 40, 44, 49, 50, 55, 60, 63, 65, 65…
Q: Calculate P, for the following data relating to the height of the plants in a garden Heights (in cm)…
A:
Q: Packed in at Rush Hour! Sq. Ft. per standing passenger Morning Morning Afternoon Afterne 1988 1.5…
A: Hello! As you have posted more than 3 sub parts, we are answering the first 3 sub-parts. In case…
Q: The length of pieces of wood (in feet) follow a N(µ = 8.1, σ = 0.1) distribution. Determine the 33rd…
A: Obtain the 33rd percentile of the lengths. The 33rd percentile of the lengths is obtained below as…
Q: Let x be the average number of employees in a group health insurance plan, and let y be the average…
A: The table with the necessary calculations is shown below: X Y X*Y X2 Y2 2 50 100 4 2500 8…
Q: A sample of two hundred and fifty families showed that ninety one owned at least one car. Find an…
A:
Q: Calculate the differences, d,. (Use Sample 1 - Sample 2.) Sample 1 5.4 3.0 4.3 8.2 2.2 Sample 2 5.7…
A: The difference is defined as d = sample 1 - sample 2
Q: Calculate skewness from the following distribution. 6 x : 1 3 4 5 7 f:. 12 27 29 19 8 4 1
A:
Q: Calculate the 30th percentile of the data shown x 2.5 4.4 5.7 7 7.6 8.1 17.8 21.2 23.9 27.8
A: The ascending order of the data is, x 2.5 4.4 5.7 7 7.6 8.1 17.8…
Q: Calculate the 30th percentile of the data shown x 4.8 12.8 17.3 22.9 26.2
A: Given data, x 4.8 12.8 17.3 22.9 26.2 Here, n=5 30th percentile=?
Q: You go out and collect the following estimates of earthworms / acre: 54,276 57,378 51,108…
A: a. 90% CI is given by- y±z*sn z value is found from z tables which is 1.645. sample size (n) is 7.…
Q: x 1.8 2.3 6.7 11.3 16.7 25.2 26.9 27.9
A: Percentile is the value in the data set below which certain percentage of the data lie. The…
Q: Find the value of median from data below : 4 5 x: 1 2 3 6. 7 8 9. 10. f: 6 15 20 9 24 18 7 5 13 21.
A: Given a frequency data, we have to find the median of the data.
Q: Find the variance in classified data set (k=5) Sınıflandırılmış verilerde varyansı bulunuz (k=5) 17…
A: calculation variance for classified data as follows, xi xi-mean (xi-mean)^2 17 -24.65 607.6225…
Q: Here is a bivariate data set. y 74 48 77 51 75 40 79 44 79 51 73 50 71 54
A: From given data set, X Y X*Y X*X Y*Y 74 48 3552 5476 2304 77 51 3927 5929 2601 75 40 3000…
Q: Use the given table to estimate the value of N(55) by averaging. t N = N(t) 10 17.6 20 23.8 30 44.6…
A:
Q: The data below are concerning the concentration of thiol in the blood lysate. 1.84 1.92 1.94 1.92…
A: A) The data below are concerning the concentration of thiol in the blood lysate. 1.84 1.92 1.94 1.92…
Q: Q2: The Bureau of Meteorology of the Australian Government provided the mean annual rainfall in…
A:
Q: A watch manufacturer claims that their watches on average will neither gain nor lose time during a…
A:
Q: 16. From the following data calculate median: No. of Students Marks Marks No. of Students Less than…
A:
Q: Calculate the median of the data shown, to two decimal places x 20.1 19.9 22.3 1.2 23.9 4 3.1 1.5…
A: Arrange the values of x in ascending order: 1.2, 1.5, 3.1, 3.6, 4, 12.1, 19.9, 20.1, 22.3, 23.9.…
Q: A blood pressure measurement consists of two numbers: the systolic pressure, which is the maximum…
A: Hii ! Thanks for posting the question . Since , your question has more than three subparts . We have…
Q: Calculate the 61th percentile of the data shown 1 13.1 28.5 29.5 29.9 32.4 41.6 42.1 43.2 67.9 |
A: Solution-: Given data: We find,
Q: 13 4 5 6 7 8 9 10 11 12 13 14 15 16 17 18 19 20 21 22 23 What percent of the data is between 4.5 and…
A:
Q: the standard error of estimate, Se given that 3.5x + 31.388889 14 15 8 Miles Travele 1, Sales, y 13…
A: These are the data that have been provided for the dependent and independent variables: Obs. XX…
Q: Calculate the arithmetic mean of the distribution : 5 10 15 20 Variate x : 25 30 35 40 45 50…
A:
Q: A publishing company is interested in understanding the relationship between the years of experience…
A: Linear regression equation : y^ = 184.76 + 47.02×x Intercept = 184.76 Here, when x = 0, the mean…
Q: Calculate the 75th percentile of the data shown x 2.9 3.5 10.7 26.7 27.7 36.5 46.7 48.3 49.2 54.4
A:
Q: A watch manufacturer claims that their watches on average will neither gain nor lose time during a…
A:
Q: blood pressure measurement consists of two numbers: the systolic pressure, which is the maximum…
A: These all answers are correct.
Q: The Credit Risk Department of a major bank estimates the default rate on loans under $10,000 to be…
A: Given: Population proportion (p) = 4% = 0.04 Number of loans that will be made (n) = 2400
Q: The following are the box office totals (in millions) from some movies that starred Bradley Cooper:…
A: Since you have posted multiple subparts , we will solve first three subparts for you. To get the…
Q: The data show the population (in thousands) for a recent year of a sample of cities in south…
A:
Q: You go out and collect the following estimates of earthworms / acre: 54,276 57,378 51,108 66,190…
A: Given, The degrees of freedom are df = n – 1 = 7 – 1 = 6
Q: : Calculate the coefficient of skewness for the follow- ing distribution : Central value : 1 2 3 4 6…
A: Given data is Central value 1 2 3 4 5 6 7 8 9 10 Frequency 2 9 11 14 20 24 20 16 5 5
Q: Calculate the coefficient of variation of a distribution with: 2*f = 110 and *² ·f = 1235 n = 10,…
A:
Q: Given the data below: 8.45 9.20 8.56 9.13 8.67 8.85 9.17 a) Find the 60th percentile (P60). b) What…
A: We have given that data First Arrange data in ascending order. Arranging Observations in the…


Trending now
This is a popular solution!

Step by step
Solved in 2 steps

- The following fictitious table shows kryptonite price, in dollar per gram, t years after 2006. t= Years since 2006 0 1 2 3 4 5 6 7 8 9 10 K= Price 56 51 50 55 58 52 45 43 44 48 51 Make a quartic model of these data. Round the regression parameters to two decimal places.Olympic Pole Vault The graph in Figure 7 indicates that in recent years the winning Olympic men’s pole vault height has fallen below the value predicted by the regression line in Example 2. This might have occurred because when the pole vault was a new event there was much room for improvement in vaulters’ performances, whereas now even the best training can produce only incremental advances. Let’s see whether concentrating on more recent results gives a better predictor of future records. (a) Use the data in Table 2 (page 176) to complete the table of winning pole vault heights shown in the margin. (Note that we are using x=0 to correspond to the year 1972, where this restricted data set begins.) (b) Find the regression line for the data in part ‚(a). (c) Plot the data and the regression line on the same axes. Does the regression line seem to provide a good model for the data? (d) What does the regression line predict as the winning pole vault height for the 2012 Olympics? Compare this predicted value to the actual 2012 winning height of 5.97 m, as described on page 177. Has this new regression line provided a better prediction than the line in Example 2?The grades of a sample of 9 students on a prelim exam (x) and on the midterm exam (y) are shown below. Find the regression equation. y = 34.661 + 0.433x y = 0.777 + 12.0623x y = 12.0623 + 0.777x y = 34.661 - 0.433x
- In order to determine a realistic price for a new product that a company wants to market the company’s research department selected 10 sites thought to have essentially identical sales potential and offered the product in each at a different price. The resulting sales are recorded in the accompanying table: Price ($) Sales ($1,000s) 15.00 15 15.50 14 16.00 16 16.50 9 17.00 12 17.50 10 18.00 8 18.50 9 19.00 6 19.50 5 h). Estimate the slope of the actual equation of the regression line using a 95% confidence interval and interpret this interval.In order to determine a realistic price for a new product that a company wants to market the company’s research department selected 10 sites thought to have essentially identical sales potential and offered the product in each at a different price. The resulting sales are recorded in the accompanying table: Price ($) Sales ($1,000s) 15.00 15 15.50 14 16.00 16 16.50 9 17.00 12 17.50 10 18.00 8 18.50 9 19.00 6 19.50 5 h). Estimate the slope of the actual equation of the regression line using a 95% confidence interval and interpret this interval using Minitab.If the standard error of the estimate for a regression model fitted to a large number of paired observations is 1.75, approximately 95% of the residuals would lie within ______. −3.50 and +3.50 −1.75 and +1.75 −0.95 and +0.95 −0.68 and +0.68 −0.97 and +0.97
- The marketing manager of a supermarket chain would like to determine the effect of shelf spaceon the sales of pet food. A random sample of 10 stores was selected, and the results are presentedbelow. Store shelf space in cm weekly sales in thousand pesos 1 45 18 2 45 21 3 75 15 4 80 18 5 95 23 6 100 26 7 135 22 8 140 27 9 185 25 10 190 28 d. Using the estimated simple linear regression equation Y=15.6414+0.0611X, estimate the weekly sales when theshelf space is 230cm? 250cm? e. Compute the coefficient of determination and interpret its value.The following estimated regression model was developed relating yearly income (y in $1000s) of 30 individuals with their age (x1) and their gender (x2) (0 if male and 1 if female).ŷ = 30 + 0.7x1 + 3x2Also provided are SST = 1200 and SSE = 384.The yearly income of a 24-year-old female individual is _____.You have obtained a sub-sample of 1744 individuals from the Current Population Survey (CPS) and are interested in the relationship between weekly earnings and age. The regression, using heteroskedasticity-robust standard errors, yielded the following result: = 239.16 + 3.75× Age, R2 = 0.15, SER = 287.21., where Earn and Age are measured in dollars and years respectively. Interpret the intercept? Interpret the slope coefficient b) Is the effect of age on earnings large? The average age in this sample is 37.5 years. What is annual income in the sample? (e) Interpret the measures of fit.
- A surgery intern has conducted a study of the sleeping habits of her colleagues and has developed a following regression equation: y-hat = 6 + 0.1X, where X is the number of hours working on one shift, and Y is the number of hours sleeping at night after that shift. Yvette worked 10 hours and slept 8 hours. What is Yvette’s residual? 0.1 1 6 7The following table shows the annual number of PhD graduates in a country in various fields. NaturalSciences Engineering SocialSciences Education 1990 70 10 60 30 1995 130 40 100 50 2000 330 130 280 140 2005 490 370 460 210 2010 590 550 830 520 2012 690 590 1,000 900 (a) With x = the number of social science doctorates and y = the number of education doctorates, use technology to obtain the regression equation. (Round coefficients to three significant digits.) y(x) =An investigation into the relationship between an adolescent mother's age x in years and the birth weight y of her baby in grams yielded the regression equation y= - 1163.45 + 245.15x as well as r = .88369, r2= .78091, SSE = 337212.45, and s= 205.30844 1) What is the predicted birth weight for a baby brn to a 17 year old woman? 2) What is the propotion of the variability in the weights of babies born to adolescent mothers that is accounted for by the mother's age? 3) For every additional year in the mother's age that mean birth weight of the baby? (a) increases by about 245g (b) decreases by about 245g (c) increases by about 1163g (d) increases by about 1163g (e) changes by an amount that cannot be determined from the information given.

