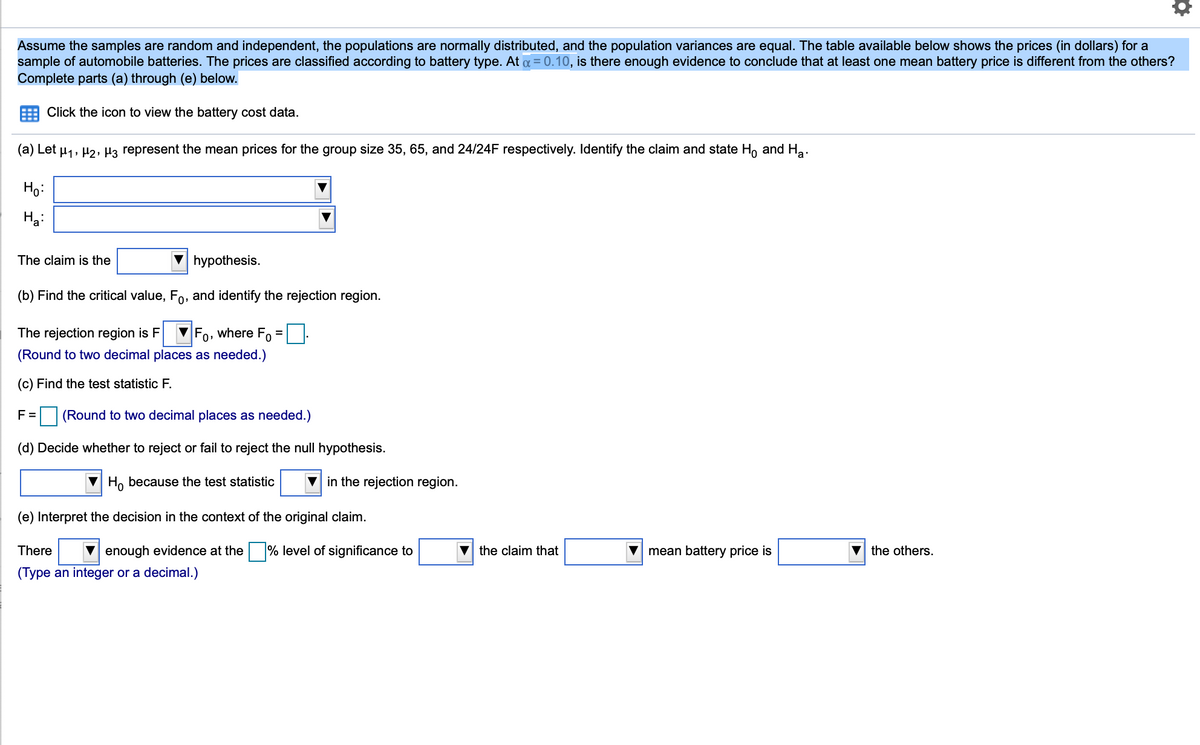
Assume the samples are random and independent, the populations are normally distributed, and the population variances are equal. The table available below shows the prices (in dollars) for a sample of automobile batteries. The prices are classified according to battery type. At α=0.10, is there enough evidence to conclude that at least one mean battery price is different from the others? Complete parts (a) through (e) below.
Transcribed Image Text:Assume the samples are random and independent, the populations are normally distributed, and the population variances are equal. The table available below shows the prices (in dollars) for a
sample of automobile batteries. The prices are classified according to battery type. At a = 0.10, is there enough evidence to conclude that at least one mean battery price is different from the others?
Complete parts (a) through (e) below.
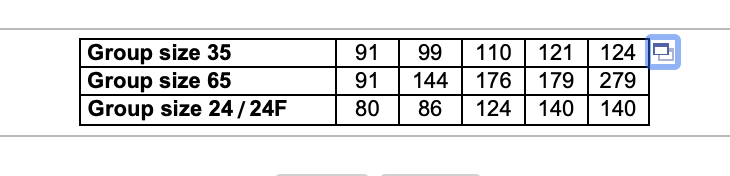
Click the icon to view the battery cost data.
(a) Let u1, H2, Hz represent the mean prices for the group size 35, 65, and 24/24F respectively. Identify the claim and state Ho and Ha.
Họ:
Ha:
The claim is the
hypothesis.
(b) Find the critical value, Fo, and identify the rejection region.
The rejection region is F
Fo, where Fo
(Round to two decimal places as needed.)
(c) Find the test statistic F.
F =
(Round to two decimal places as needed.)
(d) Decide whether to reject or fail to reject the null hypothesis.
Ho because the test statistic
in the rejection region.
(e) Interpret the decision in the context of the original claim.
There
V enough evidence at the % level of significance to
the claim that
V mean battery price is
the others.
(Type an integer or a decimal.)
Features Features Normal distribution is characterized by two parameters, mean (µ) and standard deviation (σ). When graphed, the mean represents the center of the bell curve and the graph is perfectly symmetric about the center. The mean, median, and mode are all equal for a normal distribution. The standard deviation measures the data's spread from the center. The higher the standard deviation, the more the data is spread out and the flatter the bell curve looks. Variance is another commonly used measure of the spread of the distribution and is equal to the square of the standard deviation.
Expert Solution
This question has been solved!
Explore an expertly crafted, step-by-step solution for a thorough understanding of key concepts.
Need a deep-dive on the concept behind this application? Look no further. Learn more about this topic, statistics and related others by exploring similar questions and additional content below.