Year 1 1 2 2 2 2 3 3 3 3 4 4 4 4 Quarter 2 3 4 1 2 3 4 1 2 3 4 1 2 Period 1 2 3 4 5 6 7 8 9 10 11 12 13 3 14 4 15 Excel shows a linear regression of 19,778 +724t use this Fill in All the missing information 134 Demand D 9224 13545 25235 36324 12346 19635 25743 39976 14134 14999 34123 43232 Deseasonalized Demand Seasonal Factor S
Year 1 1 2 2 2 2 3 3 3 3 4 4 4 4 Quarter 2 3 4 1 2 3 4 1 2 3 4 1 2 Period 1 2 3 4 5 6 7 8 9 10 11 12 13 3 14 4 15 Excel shows a linear regression of 19,778 +724t use this Fill in All the missing information 134 Demand D 9224 13545 25235 36324 12346 19635 25743 39976 14134 14999 34123 43232 Deseasonalized Demand Seasonal Factor S

Algebra & Trigonometry with Analytic Geometry
13th Edition
ISBN:9781133382119
Author:Swokowski
Publisher:Swokowski
Chapter4: Polynomial And Rational Functions
Section4.6: Variation
Problem 37E

Related questions
Question
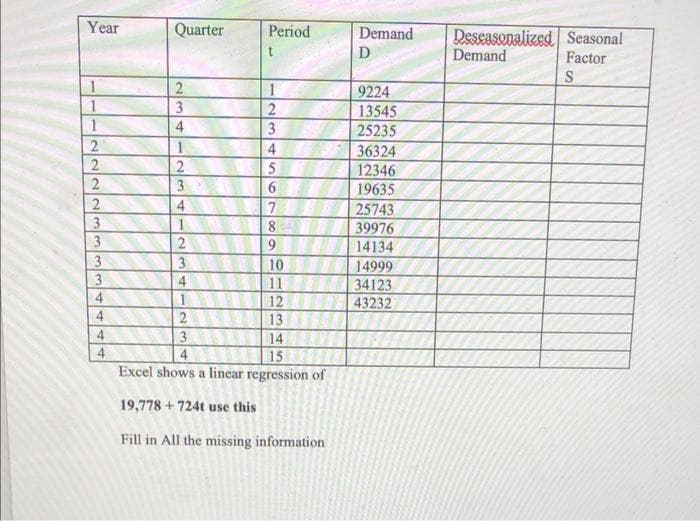
Transcribed Image Text:Year
1
1
1
2
2
2
2
3
3
3
3
4
4
4
4
Quarter
2
234
3
1
2
3
4
1
2234
1
2
3
Period
t
1
2
3
4
5
69
7
8
9
10
11
12
13
2345
14
15
Excel shows a linear regression of
19,778 +724t use this
Fill in All the missing information
Demand
D
9224
13545
25235
36324
12346
19635
25743
39976
14134
14999
34123
43232
Deseasonalized Seasonal
Demand
Factor
S
Expert Solution
This question has been solved!
Explore an expertly crafted, step-by-step solution for a thorough understanding of key concepts.

Step by step
Solved in 4 steps with 4 images

Recommended textbooks for you
Algebra & Trigonometry with Analytic Geometry
Algebra
ISBN:
9781133382119
Author:
Swokowski
Publisher:
Cengage

Big Ideas Math A Bridge To Success Algebra 1: Stu…
Algebra
ISBN:
9781680331141
Author:
HOUGHTON MIFFLIN HARCOURT
Publisher:
Houghton Mifflin Harcourt

Glencoe Algebra 1, Student Edition, 9780079039897…
Algebra
ISBN:
9780079039897
Author:
Carter
Publisher:
McGraw Hill
Algebra & Trigonometry with Analytic Geometry
Algebra
ISBN:
9781133382119
Author:
Swokowski
Publisher:
Cengage
Big Ideas Math A Bridge To Success Algebra 1: Stu…
Algebra
ISBN:
9781680331141
Author:
HOUGHTON MIFFLIN HARCOURT
Publisher:
Houghton Mifflin Harcourt
Glencoe Algebra 1, Student Edition, 9780079039897…
Algebra
ISBN:
9780079039897
Author:
Carter
Publisher:
McGraw Hill