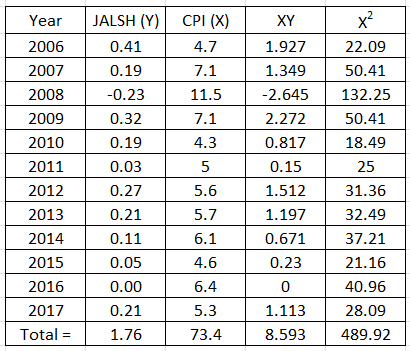
Year 2006 2007 2008 2009 2010 2011 2012 2013 2014 2015 2016 2017 Total = JALSH (Y) 0.41 0.19 -0.23 0.32 0.19 0.03 0.27 0.21 0.11 0.05 0.00 0.21 1.76 CPI (X) 4.7 7.1 11.5 7.1 4.3 5 5.6 5.7 6.1 4.6 6.4 5.3 73.4 XY 1.927 1.349 -2.645 2.272 0.817 0.15 1.512 1.197 0.671 0.23 0 1.113 8.593 x² 22.09 50.41 132.25 50.41 18.49 25 31.36 32.49 37.21 21.16 40.96 28.09 489.92


Q: 2* f(x)= e, x = 0, 1, 2, ..., and zero elsewhere, x! show that the moment generating function of X…
A:
Q: An instructor who taught two sections of engineering statistics last term, the first with 25…
A:
Q: Refer to the accompanying table, which describes results from groups of 8 births from 8 different…
A: From the provided information, The probability distribution table is as follow: Number of girls x…
Q: 3. A researcher is interested in knowing if preterm infants with late metabolic acidosis and preterm…
A: Given that: Sample n mean s With condition 38 8.5 3.5 Without condition 32 6.85 2.6
Q: A researcher is trying to determine the factors affecting the Entrance Exam Scores (EES) of the…
A: Using the above indicated code we can create the table:
Q: Which of the following is a benefit of randomization when compared to repetition? A.…
A: Given that Which of the following is a benefit of randomization when compared to repetition? A.…
Q: 10. [-/1 Points] DETAILS MY NOTES PODSTAT6 9.3.053.S. ASK YOUR TEACHER Need Help? Read It The Bureau…
A:
Q: 3. A researcher claims that the distribution of favorite pizza toppings among teenagers is as shown…
A: Given that: Observed Frequency: Topping Cheese Pepperoni Sausage Mushrooms Onions Results…
Q: n = 5,000 USE SALT Consider that for p = 0.6 and sample sizes of n = 30, n = 100, and n = 400 the…
A: Given that p^ = 0.6 , n1 = 30 , n2 = 100 , n3 = 400 , E1 = 0.175 E2 = 0.096 , E3 = 0.048
Q: 0.4 x € (0, 1) 0.2 x (1,4) 0 x (0,4) This function gives rise to a Probability Density Function…
A: We need to find the probability: P(0.11 < x < 3.97).
Q: A sample of drivers was asked whether they regularly use seat belts . The following mini tab…
A: Given,n=186x=134p^=xnp^=134186=0.72041-p^=1-0.7204=0.279698% confidence interval is (0.643889 ,…
Q: The mean daily production of a herd of cows is assumed to be normally distributed with a mean of 36…
A: Given data is Mean(μ)=36standard deviation(σ)=3.7
Q: to terpret the interval that you have constructed. O In repeated sampling, 95% of all intervals…
A: It is given that n = 64, X̄ = 13.2 s2 = 3.32 => s = 1.822 Confidence interval = 95%
Q: 3. An article by S. M. Berry titled “Drive for Show and Putt for Dough (Chance, Vol 12(4), pg…
A: Hey there! Thank you for posting the question. Since there are multiple questions posted, we will…
Q: A sample of 500 luxury hotels in the Northeast had an average room rate of $325 per night. Contruct…
A: Solution: Given information: n= 500 Sample size x =325 Sample mean σ=35 Population standard…
Q: For each of the following hypotheses, identify which statistical test we could run in order to…
A: As per our guidelines I can solve only first 3 subparts. Kindly post the remaining subparts again…
Q: a. Find the probability of getting exactly 4 sleepwalkers among 5 adults. (Type an integer or a…
A: It is given that the random variable X, the number of adults in group of five who reported…
Q: Number of Jobs A sociologist found that in a sample of 50 retired men, the average number of jobs…
A: Givensample size(n)=50Mean(x)=6.8standard deviation(σ)=1.9
Q: For the following question, assume a population mean of 100, a population standard deviation of 10…
A: We have given that Population Mean(µ) = 100Population Standard deviations (σ) = 10X ~ N (µ, σ )=…
Q: If X₁, X₂, , Xn constitute a random sample from the uniform pdf U(01; 01), i.e., (0₁ < x < 0₂); 1…
A: Given that Xi ~ Uniform (θ1 , θ2)
Q: Suppose Acap Corporation will pay a dividend of $2.73 per share at the end of this year, and $3.02…
A:
Q: When constructing a research design and the researcher has gender as a variable, please answer the…
A: Gender Is qualitative or categorical variable, that can be divided into two categories.
Q: Age of College Students Find the 80% confidence intervals for the variance and standard deviation of…
A: According to the given information in this question We need to find the confidence interval
Q: Of the 1000 comparison school students in the sample, 290 had overslept and been late to class at…
A: Since you have posted a question with multiple sub-parts, we will solve the first three sub-parts…
Q: on to teachers and administrative staff, schools also have many other employees, including bus…
A:
Q: For each of the following hypotheses, identify which statistical test we could run in order to…
A: As per the Bartleby guildlines we have to solve first three subparts and rest can be reposted...…
Q: The graph illustrates the "Distribution of College Algebra Course Grades". μl = 38 58 88 48…
A:
Q: Stock Prices A random sample of stock prices per share (in dollars) is shown. Find the 90%…
A: From the provided information, Confidence level = 90% Sample size (n) = 11
Q: Deer mice (Peromyscus maniculatus) are small rodents native of North America. Their adult body…
A: Given that Sample size n =14 Sample mean=91.1 Population standard deviation =8
Q: Question 1 Based on a national survey of adults in U.S, 60 percent of adult believe a phone-in poll…
A: Since you have asked multiple questions, we will solve the first question for you. If you want any…
Q: # 1 550 pieces of jewelry are classified according to the type of jewelry, whether it is a necklace,…
A: As per our guidelines we are suppose to answer only three subparts kindlyrepost the remaining…
Q: Briefly describe the central limit theorem and what it tells us about the central tendency,…
A: We need breifly describe the Central Limit Theorem.
Q: # 3 A bowl contains 3 yellow beads, 21 green beads, 12 blue beads, and 6 red beads. If 2 beads are…
A:
Q: Use z scores to compare the given values. Based on sample data, newborn males have weights with a…
A: The mean for males is 3209.4 and standard deviation is 744.8, the mean for females is 3023.6 and…
Q: Assume that the mean systolic blood pressure of normal adults is 120millimeters of mercury (…
A: given data,normal distributionμ=120σ=5.6n=35p(120<x¯<122.2)=?
Q: According to a government agency, the average workweek for an adult in October 2018 was 32.5 hours.…
A: Given that Sample size=35 Sample mean =33.7 Population mean =32.5 Population standard deviation =6…
Q: According to a recent reporting on a standardized test, the average math score for students in a…
A: For the distribution of the standardized test for students in a specified state, it is given that:…
Q: having a mean equal to 21 and a standard deviation equal to 8. (a) Describe the shape of the…
A: Given that. X~N( μ , ?) μ=21 , ?=8 , n=79
Q: Step 1 of 6: Find the estimated slope. Round your answer to three decimal places. Answer How to…
A: It is given that the data in tabulated form.
Q: A poll asked respondents if they had taken a vacation in the last year. The respondents were…
A:
Q: 0.4 € (0,1) 0.2 x € (1,4) 0x (0,4) This function gives rise to a Probability Density Function…
A: Given,f(x)=0.4x∈(0,1)0.2x∈(1,4)0x∉(0,4)
Q: (Be sure to show your work for all the following questions and assume a normal distribution What is…
A: According to the given information, we have Z score = -1.00 (Left tailed)
Q: For part d, I see how you get the final answer with excel, but what I'm not understanding is the…
A: Given that mean is 8.5 and standard deviation is 0.45 We have to find d.. The 90th percentile of…
Q: Perform a One-Way ANOVA test on the following dataset. Calculate up to 4 decimal places. A C 3.8 3.5…
A: The general form of ANOVA table is given below:
Q: lobe has a number of inquiries arriving in their system at 3 inquiries per minute. What is the…
A: Consider X denotes inquiries arriving in the system which follows Poisson distribution with λ=3.
Q: Question 14 Assume you have an Exponential Distribution with parameter of 0.054 Find P(x < 4.8)…
A: given data exponential distribution λ=0.054P(x>X) = e-λxP(x<X) =1- e-λx
Q: tire company makes tires that have a normal distribution with a mean of 65,000 miles with a standard…
A: Given that, a tire company makes tires that have a normal distribution with a mean of 65,000 miles…
Q: A group of neuroscientists conducted a study to determine if the neurotransmitter acetylcholine may…
A: Test is that whether neurotransmitter acetylcholine may be important for reference memory.
Q: determine the percentage of song bouts that have durations within a. one standard deviation to…
A: It is given that Mean, μ = 12.59 Standard deviation, σ = 5.31 Z-Score, Z = ( X - μ )/σ
Q: A B C D 12 20 10 10 32856 24 18 a.) State the researcher's null and alternative hypotheses (using…
A: It is given that the researcher gathers a sample of size n = 4 and gives these participants an…
|
Comment on the coefficient of CPI in the model calculated WHERE B0=0.47111 and B1= -0.05304 |

Step by step
Solved in 2 steps

- Population Genetics In the study of population genetics, an important measure of inbreeding is the proportion of homozygous genotypesthat is, instances in which the two alleles carried at a particular site on an individuals chromosomes are both the same. For population in which blood-related individual mate, them is a higher than expected frequency of homozygous individuals. Examples of such populations include endangered or rare species, selectively bred breeds, and isolated populations. in general. the frequency of homozygous children from mating of blood-related parents is greater than that for children from unrelated parents Measured over a large number of generations, the proportion of heterozygous genotypesthat is, nonhomozygous genotypeschanges by a constant factor 1 from generation to generation. The factor 1 is a number between 0 and 1. If 1=0.75, for example then the proportion of heterozygous individuals in the population decreases by 25 in each generation In this case, after 10 generations, the proportion of heterozygous individuals in the population decreases by 94.37, since 0.7510=0.0563, or 5.63. In other words, 94.37 of the population is homozygous. For specific types of matings, the proportion of heterozygous genotypes can be related to that of previous generations and is found from an equation. For mating between siblings 1 can be determined as the largest value of for which 2=12+14. This equation comes from carefully accounting for the genotypes for the present generation the 2 term in terms of those previous two generations represented by for the parents generation and by the constant term of the grandparents generation. a Find both solutions to the quadratic equation above and identify which is 1 use a horizontal span of 1 to 1 in this exercise and the following exercise. b After 5 generations, what proportion of the population will be homozygous? c After 20 generations, what proportion of the population will be homozygous?Family Planning A intend to have two children. What is tie probability that they will have child of each sex? The French mathematician IY Alembert analyzed this problem (incorrectly) by reasoning that three outcomes are possible: or two girls, or one child of each sex. He concluded that probability of having of each sex is mistakenly assuming that three outcomes are likely. (a) Model this problem with a pair of coins (using "heads" for boys and "tails" for girls). or write a program to model of problem. perform the experiment 40 mere times. Counting the number of boy-girl combinations. Estimate the probability of having child of each. (b) Calculate the correct probability of having one child of each sex and compare this with your result from part (a).A medical researcher is studying the effects of a drug on blood pressure. Subjects in the study have their blood pressure taken at the beginning of the study. After being on the medication for 4 weeks, their blood pressure is taken again. The change in blood pressure is recorded and used in doing the hypothesis test. Change: Final Blood Pressure - Initial Blood Pressure The researcher wants to know if there is evidence that the drug affects blood pressure. At the end of 4 weeks, 31 subjects in the study had an average change in blood pressure of -2.7 with a standard deviation of 5.3. Find the p-value for the hypothesis test. Your answer should be rounded to 4 decimal places.
- Cardiovascular DiseaseSuppose the incidence rate of myocardial infarction (MI) was 5 per 1000 among 45-to 54-year-old men in 2000. To look at changes in incidence over time, 5000 men in this age group were followed for 1 year starting in 2010. Fifteen new cases of MI were found. Suppose that 25% of patients with MI in 2000 died within 24 hours. This proportion is called the 24-hour case-fatality rate. 7.14 Of the 15 new MI cases in the preceding study, 5 died within 24 hours. Test whether the 24-hour casefatality rate changed from 2000 to 2010. 7.15 Suppose we eventually plan to accumulate 50 MI cases during the period 2010–2015. Assume that the 24-hour case-fatality rate is truly 20% during this period. How much power would such a study have in distinguishing between case-fatality rates in 2000 and 2010–2015 if a two-sided test with significance level .05 is planned? 7.16 How large a sample is needed in Problem 7.15 to achieve 90% power?give details on all the steps necessary to perform a test of hypothesis.A university advertises that 90% of the graduates from their school of science find a job within one year. Researchers want to see if this is really the case and they survey 60 graduates from this university at the end of the first year after graduation and find out that 50 of them were employed.For α=0.10, is there enough evidence to conclude that the one-year employment proportion of this university is different from the advertised 90%?Use test concerning Proportions: A medical doctor claims that 40% of the patients utilize health insurance, but a social worker thinks that this proportion may be is too high. In a sample of 100 medical bills, 25 were partially covered by health insurance, what can we conclude at 0.02 level of significance. A registrar claims that 45% of their students change their major after their 2nd yr due to retention policy. A random sample of 125 revealed that 50 students had changed their major after their 2nd Is there a decrease in the proportion of students who changed their major after their 2nd yr, test at 0.02 level of significance. A barangay captain claims that at least 85% of the residents in his barangay have household pets. To test this claim a researcher randomly selected a sample of 550 residents and find that 495 of them do have pets. What can you conclude at 0.10 level of significance. Test at 0.01 whether the performance in the training program and success in the job are…
- Cardiovascular DiseaseSuppose the incidence rate of myocardial infarction (MI)was 5 per 1000 among 45- to 54-year-old men in 2000.To look at changes in incidence over time, 5000 men in thisage group were followed for 1 year starting in 2010. Fifteennew cases of MI were found.Suppose that 25% of patients with MI in 2000 died within24 hours. This proportion is called the 24-hour case-fatalityrate.7.14 Of the 15 new MI cases in the preceding study,5 died within 24 hours. Test whether the 24-hour casefatality rate changed from 2000 to 2010.Cardiovascular DiseaseSuppose the incidence rate of myocardial infarction (MI)was 5 per 1000 among 45- to 54-year-old men in 2000.To look at changes in incidence over time, 5000 men in thisage group were followed for 1 year starting in 2010. Fifteennew cases of MI were found. Suppose that 25% of patients with MI in 2000 died within24 hours. This proportion is called the 24-hour case-fatalityrate.7.14 Of the 15 new MI cases in the preceding study,5 died within 24 hours. Test whether the 24-hour casefatality rate changed from 2000 to 2010.The Difference of Two Sample Proportions: III Belinda plans to take a simple random sample of 2500 U.S. adults and to compute the proportion of them who believe in the theory of evolution. (Call this sample proportion p1-hat.) She also intends to take an independent simple random sample of 1600 adults from France and to compute the the proportion of them who believe in the theory of evolution. (Call this sample proportion p2-hat.) Unknown to Belinda, the proportion of all U.S. adults who believe in the theory of evolution is 0.50 (or 50%), whereas the proportion of all French adults who believe in the theory of evolution is 0.75, or 75%. Using the expected value and the SD of p1-hat minus p2-hat, which of the following makes the most sense? Group of answer choices ( ) The percentage of adults in the U.S. sample who believe in evolution should turn out to be about 25% less than the percentage of adults in the French sample who believe in evolution, give or take about 3% or so for…
- Dr. Abba hypothesizes A physician hypothesizes that males have higher systolic blood pressure than females. that students will rate their life satisfaction lower at the completion of a humanities course. To test this hypothesis, he collects life satisfaction ratings for all students in the course at the start of the semester and again at the end of the semester. Below are the data. What can be concluded with an an α of 0.05? start end 82758281918187767582 91848693908887798887 A) Obtain/compute the appropriate values to make a decision about H0. critical value= t statistic= B) If appropriate, compute the CI. If not appropriate, input "na" for both spaces below. C)Compute the corresponding effect size(s) and indicate magnitude(s).If not appropriate, input and/or select "na" below. d= r2=6. True or False? Assume the below life table was constructed from following individuals who were diagnosed with slow-progressing form of prostate cancer and decided not to receive treatment of any form. The calculated survival probability for year 3, if the Kaplan-Meir approach is used to calculate the survival probability, is approximately 0.7438. Time in years Number at risk Nt Number of deaths, Dt Number of censored Ct Survival Probability 0 20 1 1 20 3 2 17 1 3 16 2 1A health officer is trying to study the malaria situation of Zambia. From the records of seasonal blood survey (SBS) results he came to understand that the proportion of people having malaria in Zambia was 3.8% in 2015. The size of the sample considered was 15,000. He also realized that during the year that followed (2016), blood samples were taken from 10,000 randomly selected persons. The result of the 2016 seasonal blood survey showed that 200 persons were positive for malaria. Help the Health officer in testing the hypothesis that the malaria situation of 2016 did not show any significant difference from that of 2015 (take the 5% level of significance).

