Year 2016 Year 2017 Year 2018 Price Quantity Price Quantity Price Quantity Slime 6. 50 9. 60 10 56 Sticky tact Stinky egg |Teddy Bear Tortoise 2 100 2 105 120 4 60 4 50 60 10 30 11 26 12 24 8. 40 11 39 12 36 (a) By using the above data, compute the Laspeyres Price Index for year 2018 by using year 2016 as base year. (b) Interpret your answer in part (a)). (c) By using the above data, compute the Paasche Price Index for year 2018 by using year 2016 as base year. (d) Which item has experienced the greatest inflation rate from year 2017 to year 2018? (Just state your answer, no calculation is needed in part (d)).
Year 2016 Year 2017 Year 2018 Price Quantity Price Quantity Price Quantity Slime 6. 50 9. 60 10 56 Sticky tact Stinky egg |Teddy Bear Tortoise 2 100 2 105 120 4 60 4 50 60 10 30 11 26 12 24 8. 40 11 39 12 36 (a) By using the above data, compute the Laspeyres Price Index for year 2018 by using year 2016 as base year. (b) Interpret your answer in part (a)). (c) By using the above data, compute the Paasche Price Index for year 2018 by using year 2016 as base year. (d) Which item has experienced the greatest inflation rate from year 2017 to year 2018? (Just state your answer, no calculation is needed in part (d)).

Chapter6: Tracking The U.s. Economy
Section: Chapter Questions
Problem 4.8P

Related questions
Question
do part d
Transcribed Image Text:Elementary Statistics
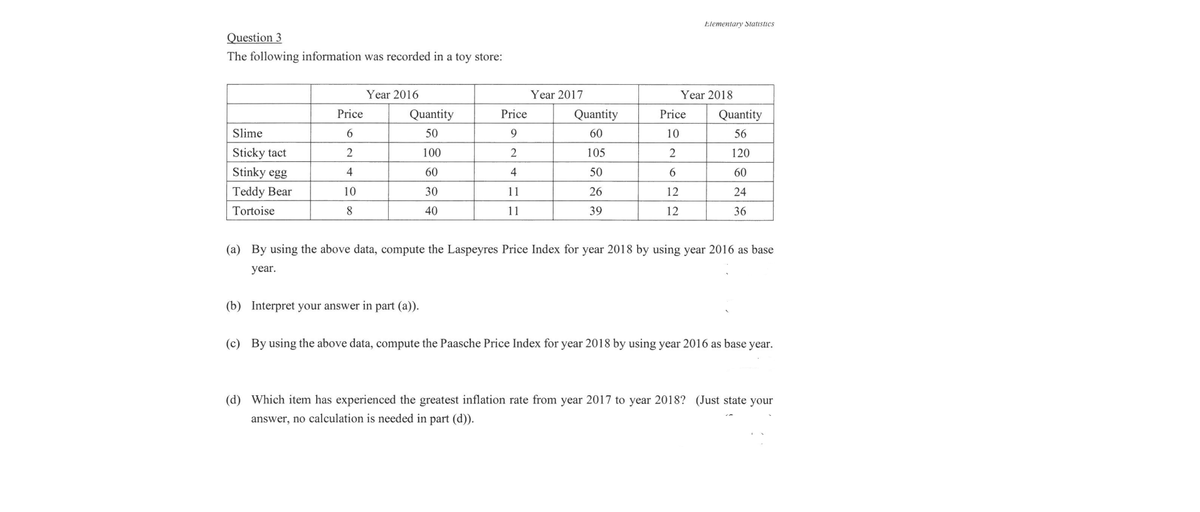
Question 3
The following information was recorded in a toy store:
Year 2016
Year 2017
Year 2018
Price
Quantity
Price
Quantity
Price
Quantity
Slime
6
50
9.
60
10
56
Sticky tact
100
105
120
Stinky egg
4
60
4
50
6.
60
Teddy Bear
10
30
11
26
12
24
Tortoise
8.
40
11
39
12
36
(a) By using the above data, compute the Laspeyres Price Index for year 2018 by using year 2016 as base
year.
(b) Interpret your answer in part (a)).
(c) By using the above data, compute the Paasche Price Index for year 2018 by using year 2016 as base year.
(d) Which item has experienced the greatest inflation rate from year 2017 to year 2018? (Just state your
answer, no calculation is needed in part (d)).
Expert Solution
This question has been solved!
Explore an expertly crafted, step-by-step solution for a thorough understanding of key concepts.

Step by step
Solved in 2 steps

Knowledge Booster


Learn more about
Need a deep-dive on the concept behind this application? Look no further. Learn more about this topic, economics and related others by exploring similar questions and additional content below.Recommended textbooks for you


