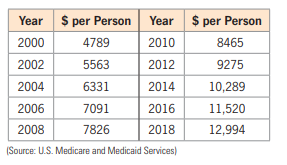
Year $ per Person Year $ per Person 2000 4789 2010 8465 2002 5563 2012 9275 2004 6331 2014 10,289 2006 7091 2016 11,520 2008 7826 2018 12,994 (Source: U.S. Medicare and Medicaid Services)


Equations and Inequations
Equations and inequalities describe the relationship between two mathematical expressions.
Linear Functions
A linear function can just be a constant, or it can be the constant multiplied with the variable like x or y. If the variables are of the form, x2, x1/2 or y2 it is not linear. The exponent over the variables should always be 1.
Expenditures for U.S. Health Care The cost per person per year for health care, with projections to 2018,
is shown in the following table
a. Let x represent the number of years after 2000 and
y represent the annual cost, and sketch the
plot
b. Graph the
c. Is the function a good visual fit to the data?

Step by step
Solved in 2 steps with 2 images


