Population of Barangay X Year 2010 2011 2012 2013 2014 2015 Population 20,531 21,935 23,436 25,034 26,751 28,581 Instructions: 1. Find the rate of increase of population in Barangay X from 2010 to 2015. (round off answer up to two decimal places)
Population of Barangay X Year 2010 2011 2012 2013 2014 2015 Population 20,531 21,935 23,436 25,034 26,751 28,581 Instructions: 1. Find the rate of increase of population in Barangay X from 2010 to 2015. (round off answer up to two decimal places)

College Algebra (MindTap Course List)
12th Edition
ISBN:9781305652231
Author:R. David Gustafson, Jeff Hughes
Publisher:R. David Gustafson, Jeff Hughes
Chapter3: Functions
Section3.3: More On Functions; Piecewise-defined Functions
Problem 88E

Related questions

Topic Video
Question
100%
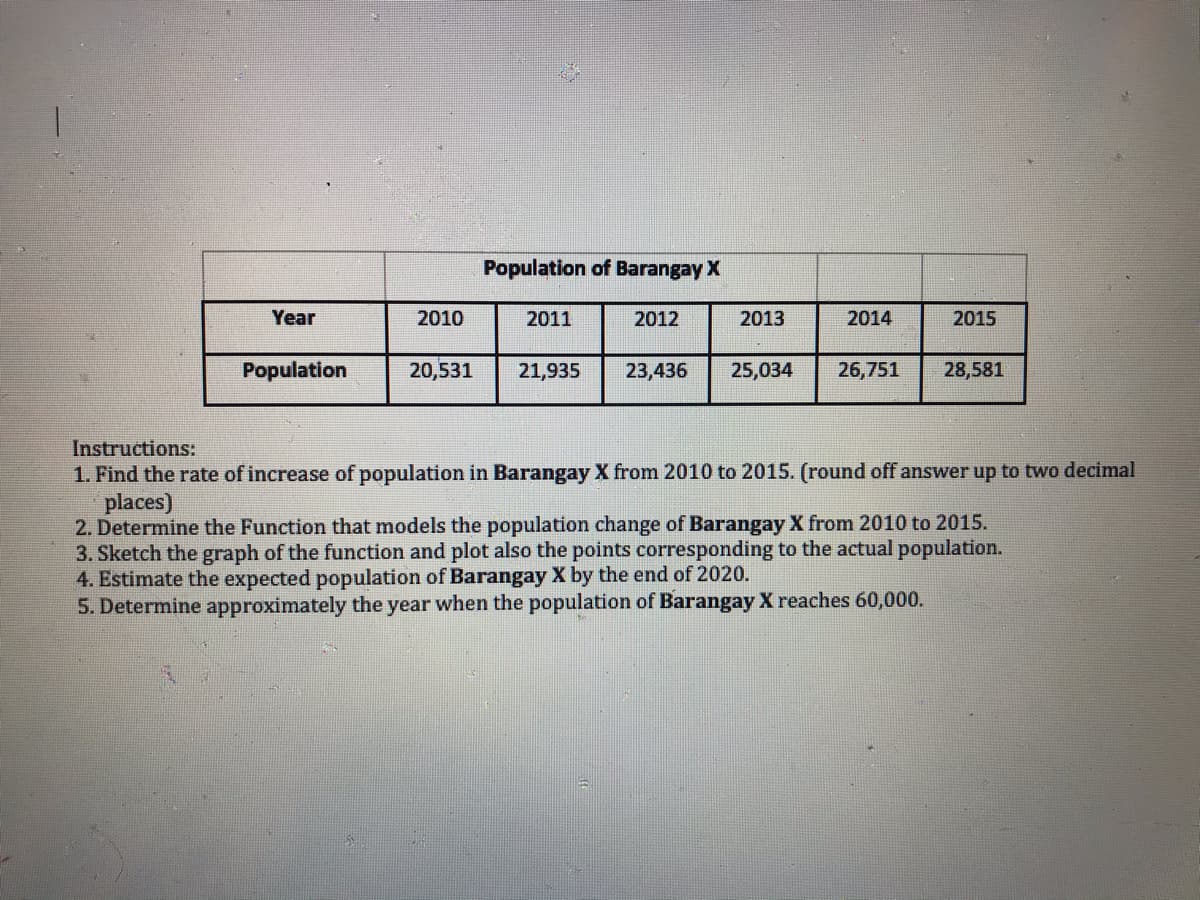
Transcribed Image Text:Population of Barangay X
Year
2010
2011
2012
2013
2014
2015
Population
20,531
21,935
23,436
25,034
26,751
28,581
Instructions:
1. Find the rate of increase of population in Barangay X from 2010 to 2015. (round off answer up to two decimal
places)
2. Determine the Function that models the population change of Barangay X from 2010 to 2015.
3. Sketch the graph of the function and plot also the points corresponding to the actual population.
4. Estimate the expected population of Barangay X by the end of 2020.
5. Determine approximately the year when the population of Barangay X reaches 60,000.
Expert Solution
This question has been solved!
Explore an expertly crafted, step-by-step solution for a thorough understanding of key concepts.

Step by step
Solved in 3 steps

Follow-up Questions
Read through expert solutions to related follow-up questions below.
Follow-up Question
Whats the answer for number 2 to 5?

Transcribed Image Text:Year
Population
2010
Population of Barangay X
2011
2012
2013
20,531 21,935 23,436 25,034
2014
26,751
2015
28,581
Instructions:
1. Find the rate of increase of population in Barangay X from 2010 to 2015. (round off answer up to two decimal
places)
2. Determine the Function that models the population change of Barangay X from 2010 to 2015.
3. Sketch the graph of the function and plot also the points corresponding to the actual population.
4. Estimate the expected population of Barangay X by the end of 2020.
5. Determine approximately the year when the population of Barangay X reaches 60,000.
Transcribed Image Text: Population of Barangay X Year 2010
2011 2012 2013 2014 2015 Population 20,531 21,935 23,436 25,034
26,751 28,581 Instructions: 1. Find the rate of increase of
population in Barangay X from 2010 to 2015. (round off answer up
to two decimal places) 2. Determine the Function that models the
population change of Barangay X from 2010 to 2015. 3. Sketch the
graph of the function and plot also the points corresponding to
the actual population. 4. Estimate the expected population of
Barangay X by the end of 2020. 5. Determine approximately the
year when the population of Barangay X reaches 60,000.
Solution
Knowledge Booster


Learn more about
Need a deep-dive on the concept behind this application? Look no further. Learn more about this topic, advanced-math and related others by exploring similar questions and additional content below.Recommended textbooks for you
College Algebra (MindTap Course List)
Algebra
ISBN:
9781305652231
Author:
R. David Gustafson, Jeff Hughes
Publisher:
Cengage Learning

Big Ideas Math A Bridge To Success Algebra 1: Stu…
Algebra
ISBN:
9781680331141
Author:
HOUGHTON MIFFLIN HARCOURT
Publisher:
Houghton Mifflin Harcourt

College Algebra
Algebra
ISBN:
9781305115545
Author:
James Stewart, Lothar Redlin, Saleem Watson
Publisher:
Cengage Learning
College Algebra (MindTap Course List)
Algebra
ISBN:
9781305652231
Author:
R. David Gustafson, Jeff Hughes
Publisher:
Cengage Learning
Big Ideas Math A Bridge To Success Algebra 1: Stu…
Algebra
ISBN:
9781680331141
Author:
HOUGHTON MIFFLIN HARCOURT
Publisher:
Houghton Mifflin Harcourt
College Algebra
Algebra
ISBN:
9781305115545
Author:
James Stewart, Lothar Redlin, Saleem Watson
Publisher:
Cengage Learning

Algebra & Trigonometry with Analytic Geometry
Algebra
ISBN:
9781133382119
Author:
Swokowski
Publisher:
Cengage