Year 10 Yr Inflation 20 Yr Bond Yield 1956 0.025814878 0.0345 1957 0.019835599 0.0323 1958 0.018893854 0.0382 1959 0.022195243 0.0447 1960 0.01787712 0.0380 1961 0.012678833 0.0415 1962 0.013016258 0.0395 1963 0.01403842 0.0417 1964 0.015728851 0.0423 1965 0.017275388 0.0450 1966 0.01777163 0.0455 1967 0.017790153 0.0556 1968 0.020756834 0.0598 1969 0.025364711 0.0687 1970 0.029381652 0.0648 1971 0.032067163 0.0597 1972 0.034253897 0.0599 1973 0.041402732 0.0726 1974 0.05241841 0.0760 1975 0.057507736 0.0805 1976 0.058964243 0.0721 1977 0.062688494 0.0803 1978 0.066992335 0.0898 1979 0.074192762 0.1012 1980 0.081095098 0.1199 1981 0.0866764 0.1334 1982 0.087135714 0.1095 1983 0.082136616 0.1197 1984 0.073938451 0.1170 1985 0.070644276 0.0956 1986 0.066962977 0.0789 1987 0.064604182 0.0920 1988 0.059994599 0.0918 1989 0.051328855 0.0816 1990 0.045045962 0.0844 1991 0.039173687 0.0730 1992 0.03820184 0.0726 1993 0.03714698 0.0654 1994 0.035819774 0.0799 1995 0.034844836 0.0603
Year 10 Yr Inflation 20 Yr Bond Yield 1956 0.025814878 0.0345 1957 0.019835599 0.0323 1958 0.018893854 0.0382 1959 0.022195243 0.0447 1960 0.01787712 0.0380 1961 0.012678833 0.0415 1962 0.013016258 0.0395 1963 0.01403842 0.0417 1964 0.015728851 0.0423 1965 0.017275388 0.0450 1966 0.01777163 0.0455 1967 0.017790153 0.0556 1968 0.020756834 0.0598 1969 0.025364711 0.0687 1970 0.029381652 0.0648 1971 0.032067163 0.0597 1972 0.034253897 0.0599 1973 0.041402732 0.0726 1974 0.05241841 0.0760 1975 0.057507736 0.0805 1976 0.058964243 0.0721 1977 0.062688494 0.0803 1978 0.066992335 0.0898 1979 0.074192762 0.1012 1980 0.081095098 0.1199 1981 0.0866764 0.1334 1982 0.087135714 0.1095 1983 0.082136616 0.1197 1984 0.073938451 0.1170 1985 0.070644276 0.0956 1986 0.066962977 0.0789 1987 0.064604182 0.0920 1988 0.059994599 0.0918 1989 0.051328855 0.0816 1990 0.045045962 0.0844 1991 0.039173687 0.0730 1992 0.03820184 0.0726 1993 0.03714698 0.0654 1994 0.035819774 0.0799 1995 0.034844836 0.0603

Algebra & Trigonometry with Analytic Geometry
13th Edition
ISBN:9781133382119
Author:Swokowski
Publisher:Swokowski
Chapter5: Inverse, Exponential, And Logarithmic Functions
Section5.3: The Natural Exponential Function
Problem 40E

Related questions
Question
| Year | 10 Yr Inflation | 20 Yr Bond Yield |
| 1956 | 0.025814878 | 0.0345 |
| 1957 | 0.019835599 | 0.0323 |
| 1958 | 0.018893854 | 0.0382 |
| 1959 | 0.022195243 | 0.0447 |
| 1960 | 0.01787712 | 0.0380 |
| 1961 | 0.012678833 | 0.0415 |
| 1962 | 0.013016258 | 0.0395 |
| 1963 | 0.01403842 | 0.0417 |
| 1964 | 0.015728851 | 0.0423 |
| 1965 | 0.017275388 | 0.0450 |
| 1966 | 0.01777163 | 0.0455 |
| 1967 | 0.017790153 | 0.0556 |
| 1968 | 0.020756834 | 0.0598 |
| 1969 | 0.025364711 | 0.0687 |
| 1970 | 0.029381652 | 0.0648 |
| 1971 | 0.032067163 | 0.0597 |
| 1972 | 0.034253897 | 0.0599 |
| 1973 | 0.041402732 | 0.0726 |
| 1974 | 0.05241841 | 0.0760 |
| 1975 | 0.057507736 | 0.0805 |
| 1976 | 0.058964243 | 0.0721 |
| 1977 | 0.062688494 | 0.0803 |
| 1978 | 0.066992335 | 0.0898 |
| 1979 | 0.074192762 | 0.1012 |
| 1980 | 0.081095098 | 0.1199 |
| 1981 | 0.0866764 | 0.1334 |
| 1982 | 0.087135714 | 0.1095 |
| 1983 | 0.082136616 | 0.1197 |
| 1984 | 0.073938451 | 0.1170 |
| 1985 | 0.070644276 | 0.0956 |
| 1986 | 0.066962977 | 0.0789 |
| 1987 | 0.064604182 | 0.0920 |
| 1988 | 0.059994599 | 0.0918 |
| 1989 | 0.051328855 | 0.0816 |
| 1990 | 0.045045962 | 0.0844 |
| 1991 | 0.039173687 | 0.0730 |
| 1992 | 0.03820184 | 0.0726 |
| 1993 | 0.03714698 | 0.0654 |
| 1994 | 0.035819774 | 0.0799 |
| 1995 | 0.034844836 | 0.0603 |
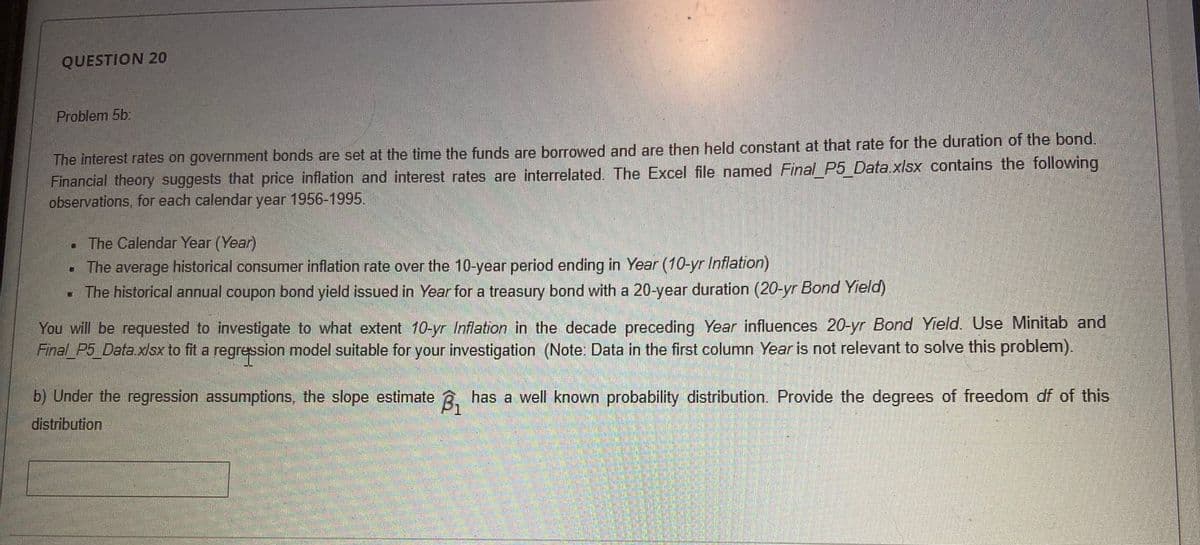
Transcribed Image Text:QUESTION 20
Problem 5b:
The interest rates on government bonds are set at the time the funds are borrowed and are then held constant at that rate for the duration of the bond.
Financial theory suggests that price inflation and interest rates are interrelated. The Excel file named Final P5 Data.xlsx contains the following
observations, for each calendar year 1956-1995.
• The Calendar Year (Year)
The average historical consumer inflation rate over the 10-year period ending in Year (10-yr Inflation)
• The historical annual coupon bond yield issued in Year for a treasury bond with a 20-year duration (20-yr Bond Yield)
You will be requested to investigate to what extent 10-yr Inflation in the decade preceding Year influences 20-yr Bond Yield. Use Minitab and
Final P5 Data.x/sx to fit a regression model suitable for your investigation (Note: Data in the first column Year is not relevant to solve this problem).
b) Under the regression assumptions, the slope estimate R, has a well known probability distribution. Provide the degrees of freedom df of this
distribution
Expert Solution
This question has been solved!
Explore an expertly crafted, step-by-step solution for a thorough understanding of key concepts.

Step by step
Solved in 2 steps

Recommended textbooks for you
Algebra & Trigonometry with Analytic Geometry
Algebra
ISBN:
9781133382119
Author:
Swokowski
Publisher:
Cengage


College Algebra
Algebra
ISBN:
9781305115545
Author:
James Stewart, Lothar Redlin, Saleem Watson
Publisher:
Cengage Learning
Algebra & Trigonometry with Analytic Geometry
Algebra
ISBN:
9781133382119
Author:
Swokowski
Publisher:
Cengage
College Algebra
Algebra
ISBN:
9781305115545
Author:
James Stewart, Lothar Redlin, Saleem Watson
Publisher:
Cengage Learning