Yeast cells use sugars to undergo the chemical reactions of cellular respiration. We will test the ability of yeast cells to sucrose as an energy source for cellular respiration. We will examine if various concentrations of sucrose has an effect on cellular respiration and whether the temperature also plays a role in cellular respiration Answer these questions based on the video posted: Using this data table graph the data from the experiment in the video: Amount of Foam in the Yeast Experiment Time 20°C/RT 30°C 40°C 50°C 60°C O min Ост Ocm Ocm Ocm Ост 10 min 1.5cm 4cm 11cm 6cm Зст 20 min 2.5cm 9.5cm 17cm 11cm 9cm 30 min 4.5cm 13cm 18cm 10cm 11cm Using the data presented in the video for the yeast experiment draw a line graph. There are time points shown - 0, 10, 20 and 30 minutes. Plot a line graph of the foam level(s) for each temperature versus time (Time is on the x axis in minutes- while the amount of foam (in cm) is on the y-axis) All 4 line graphs should be on the same graph paper. Make sure to properly label each graph. 1. The variables that are controlled for in this experiment are that apply. Select all A. Not shown in the video B. Amount of water C. Amount of yeast D. The size of the bottle E. The temperature of the water
Yeast cells use sugars to undergo the chemical reactions of cellular respiration. We will test the ability of yeast cells to sucrose as an energy source for cellular respiration. We will examine if various concentrations of sucrose has an effect on cellular respiration and whether the temperature also plays a role in cellular respiration Answer these questions based on the video posted: Using this data table graph the data from the experiment in the video: Amount of Foam in the Yeast Experiment Time 20°C/RT 30°C 40°C 50°C 60°C O min Ост Ocm Ocm Ocm Ост 10 min 1.5cm 4cm 11cm 6cm Зст 20 min 2.5cm 9.5cm 17cm 11cm 9cm 30 min 4.5cm 13cm 18cm 10cm 11cm Using the data presented in the video for the yeast experiment draw a line graph. There are time points shown - 0, 10, 20 and 30 minutes. Plot a line graph of the foam level(s) for each temperature versus time (Time is on the x axis in minutes- while the amount of foam (in cm) is on the y-axis) All 4 line graphs should be on the same graph paper. Make sure to properly label each graph. 1. The variables that are controlled for in this experiment are that apply. Select all A. Not shown in the video B. Amount of water C. Amount of yeast D. The size of the bottle E. The temperature of the water

Biochemistry
6th Edition
ISBN:9781305577206
Author:Reginald H. Garrett, Charles M. Grisham
Publisher:Reginald H. Garrett, Charles M. Grisham
Chapter21: Photosynthesis
Section: Chapter Questions
Problem 5P: The Relative Efficiency of ATP Synthesis in Noncyclic versus Cyclic Photophosphorylation If...

Related questions
Question
100%
Transcribed Image Text:AaBbCcDd AaBbCcDd AaBbC AaBbCcC AaB AaBbC
I Normal
1 No Spac. Heading 1 Heading 2
Title
Subtit
Paragraph
Styles
BIO 121 Section
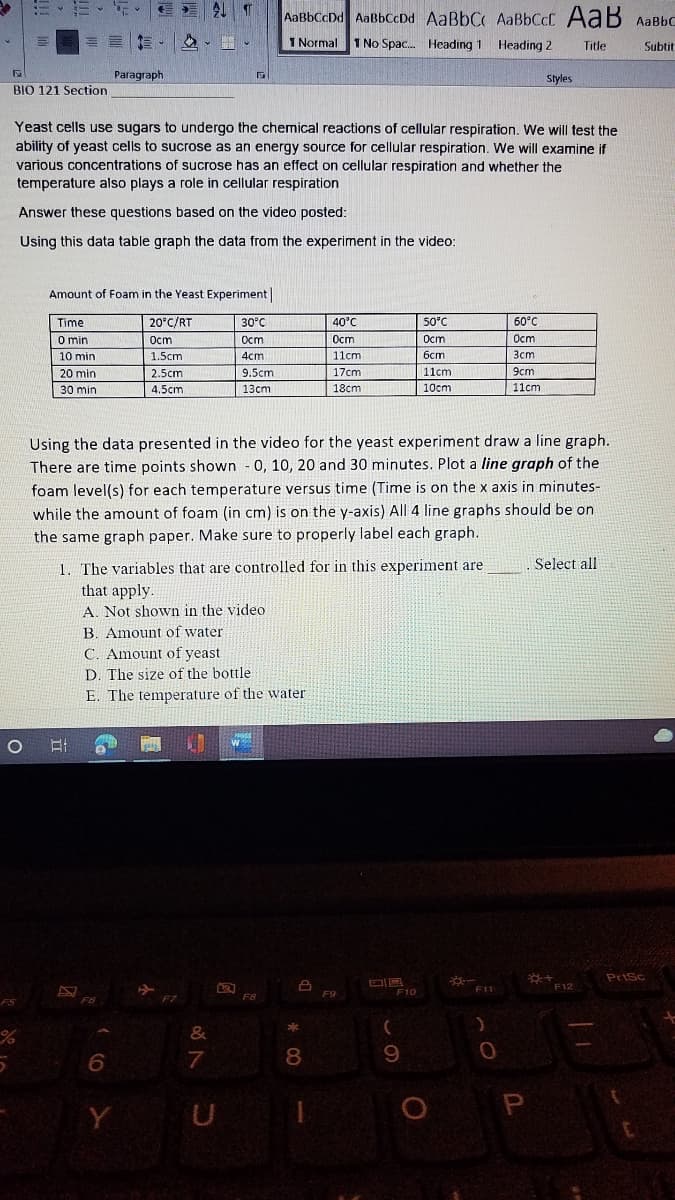
Yeast cells use sugars to undergo the chemical reactions of cellular respiration. We will test the
ability of yeast cells to sucrose as an energy source for cellular respiration. We will examine if
various concentrations of sucrose has an effect on cellular respiration and whether the
temperature also plays a role in cellular respiration
Answer these questions based on the video posted:
Using this data table graph the data from the experiment in the video:
Amount of Foam in the Yeast Experiment|
Time
20°C/RT
30°C
40°C
50°C
60°C
O min
Ост
Ocm
Ocm
Ост
Ост
10 min
1.5cm
4cm
11cm
бст
Зст
20 min
2.5cm
9.5cm
17cm
11cm
9cm
30 min
4.5cm
13cm
18cm
10cm
11cm
Using the data presented in the video for the yeast experiment draw a line graph.
There are time points shown 0, 10, 20 and 30 minutes. Plot a line graph of
foam level(s) for each temperature versus time (Time is on the x axis in minutes-
while the amount of foam (in cm) is on the y-axis) All 4 line graphs should be on
the same graph paper. Make sure to properly label each graph.
1. The variables that are controlled for in this experiment are
that apply.
A. Not shown in the video
B. Amount of water
Select all
C. Amount of yeast
D. The size of the bottle
E. The temperature of the wvater
Prisc
F12
F10
F11
F7
6.
7
8.
9
Y
Expert Solution
This question has been solved!
Explore an expertly crafted, step-by-step solution for a thorough understanding of key concepts.

This is a popular solution!

Trending now
This is a popular solution!

Step by step
Solved in 2 steps with 1 images

Knowledge Booster


Learn more about
Need a deep-dive on the concept behind this application? Look no further. Learn more about this topic, biology and related others by exploring similar questions and additional content below.Recommended textbooks for you
Biochemistry
Biochemistry
ISBN:
9781305577206
Author:
Reginald H. Garrett, Charles M. Grisham
Publisher:
Cengage Learning

Biology: The Dynamic Science (MindTap Course List)
Biology
ISBN:
9781305389892
Author:
Peter J. Russell, Paul E. Hertz, Beverly McMillan
Publisher:
Cengage Learning

Biology (MindTap Course List)
Biology
ISBN:
9781337392938
Author:
Eldra Solomon, Charles Martin, Diana W. Martin, Linda R. Berg
Publisher:
Cengage Learning
Biochemistry
Biochemistry
ISBN:
9781305577206
Author:
Reginald H. Garrett, Charles M. Grisham
Publisher:
Cengage Learning
Biology: The Dynamic Science (MindTap Course List)
Biology
ISBN:
9781305389892
Author:
Peter J. Russell, Paul E. Hertz, Beverly McMillan
Publisher:
Cengage Learning
Biology (MindTap Course List)
Biology
ISBN:
9781337392938
Author:
Eldra Solomon, Charles Martin, Diana W. Martin, Linda R. Berg
Publisher:
Cengage Learning

Concepts of Biology
Biology
ISBN:
9781938168116
Author:
Samantha Fowler, Rebecca Roush, James Wise
Publisher:
OpenStax College