You are conducting a study to see if the proportion of voters who prefer the Democratic candidate is significantly different from 65% at a level of significance of α = 0.05. According to your sample, 47 out of 70 potential voters prefer the Democratic candidate. a. For this study, we should use Select an answer b. The null and alternative hypotheses would be: (please enter a decimal) Please enter a decimal) (please show your answer to 3 decimal places.) c. The test statistic? d. The p-value e. The p-value is ?' f. Based on this, we should Select an answer g. Thus, the final conclusion is that Please show your ansver to 4 decimal places) the null hypothesis. The data suggest the population proportion is not significantly different from 65% at α-0.05, so there is not sufficient evidence to conclude that the proportion of voters who prefer the Democratic candidate is different from 6500. The data suggest the populaton proportion is significantly different from 65% at a sufficient evidence to conclude that the proportion of different from 65% 0.05, so there is voters who prefer the Democratic candidate is data suggest the population proportion is not significantly different from 65% at α-0.05, so there is ufficient evidence to conclude that the proportion of voters who prefer the Democratic candidate is equal to 65o h. Interpret the p-value in the context of the study If the population proportion of voters who prefer the Democratic candidate is 650o and if another 70 voters are surveyed then there would be a 70.7% chance that either more than 67% of the 70 voters surren ed prefer the Democratic candidate or fewer than 638o of the 70 voters surveyed prefer the Democratic candidate There is a 70.7% chance that the percent of all voters who prefer the Democratic candidate differs from 6500
You are conducting a study to see if the proportion of voters who prefer the Democratic candidate is significantly different from 65% at a level of significance of α = 0.05. According to your sample, 47 out of 70 potential voters prefer the Democratic candidate. a. For this study, we should use Select an answer b. The null and alternative hypotheses would be: (please enter a decimal) Please enter a decimal) (please show your answer to 3 decimal places.) c. The test statistic? d. The p-value e. The p-value is ?' f. Based on this, we should Select an answer g. Thus, the final conclusion is that Please show your ansver to 4 decimal places) the null hypothesis. The data suggest the population proportion is not significantly different from 65% at α-0.05, so there is not sufficient evidence to conclude that the proportion of voters who prefer the Democratic candidate is different from 6500. The data suggest the populaton proportion is significantly different from 65% at a sufficient evidence to conclude that the proportion of different from 65% 0.05, so there is voters who prefer the Democratic candidate is data suggest the population proportion is not significantly different from 65% at α-0.05, so there is ufficient evidence to conclude that the proportion of voters who prefer the Democratic candidate is equal to 65o h. Interpret the p-value in the context of the study If the population proportion of voters who prefer the Democratic candidate is 650o and if another 70 voters are surveyed then there would be a 70.7% chance that either more than 67% of the 70 voters surren ed prefer the Democratic candidate or fewer than 638o of the 70 voters surveyed prefer the Democratic candidate There is a 70.7% chance that the percent of all voters who prefer the Democratic candidate differs from 6500

MATLAB: An Introduction with Applications
6th Edition
ISBN:9781119256830
Author:Amos Gilat
Publisher:Amos Gilat
Chapter1: Starting With Matlab
Section: Chapter Questions
Problem 1P

Related questions
Question
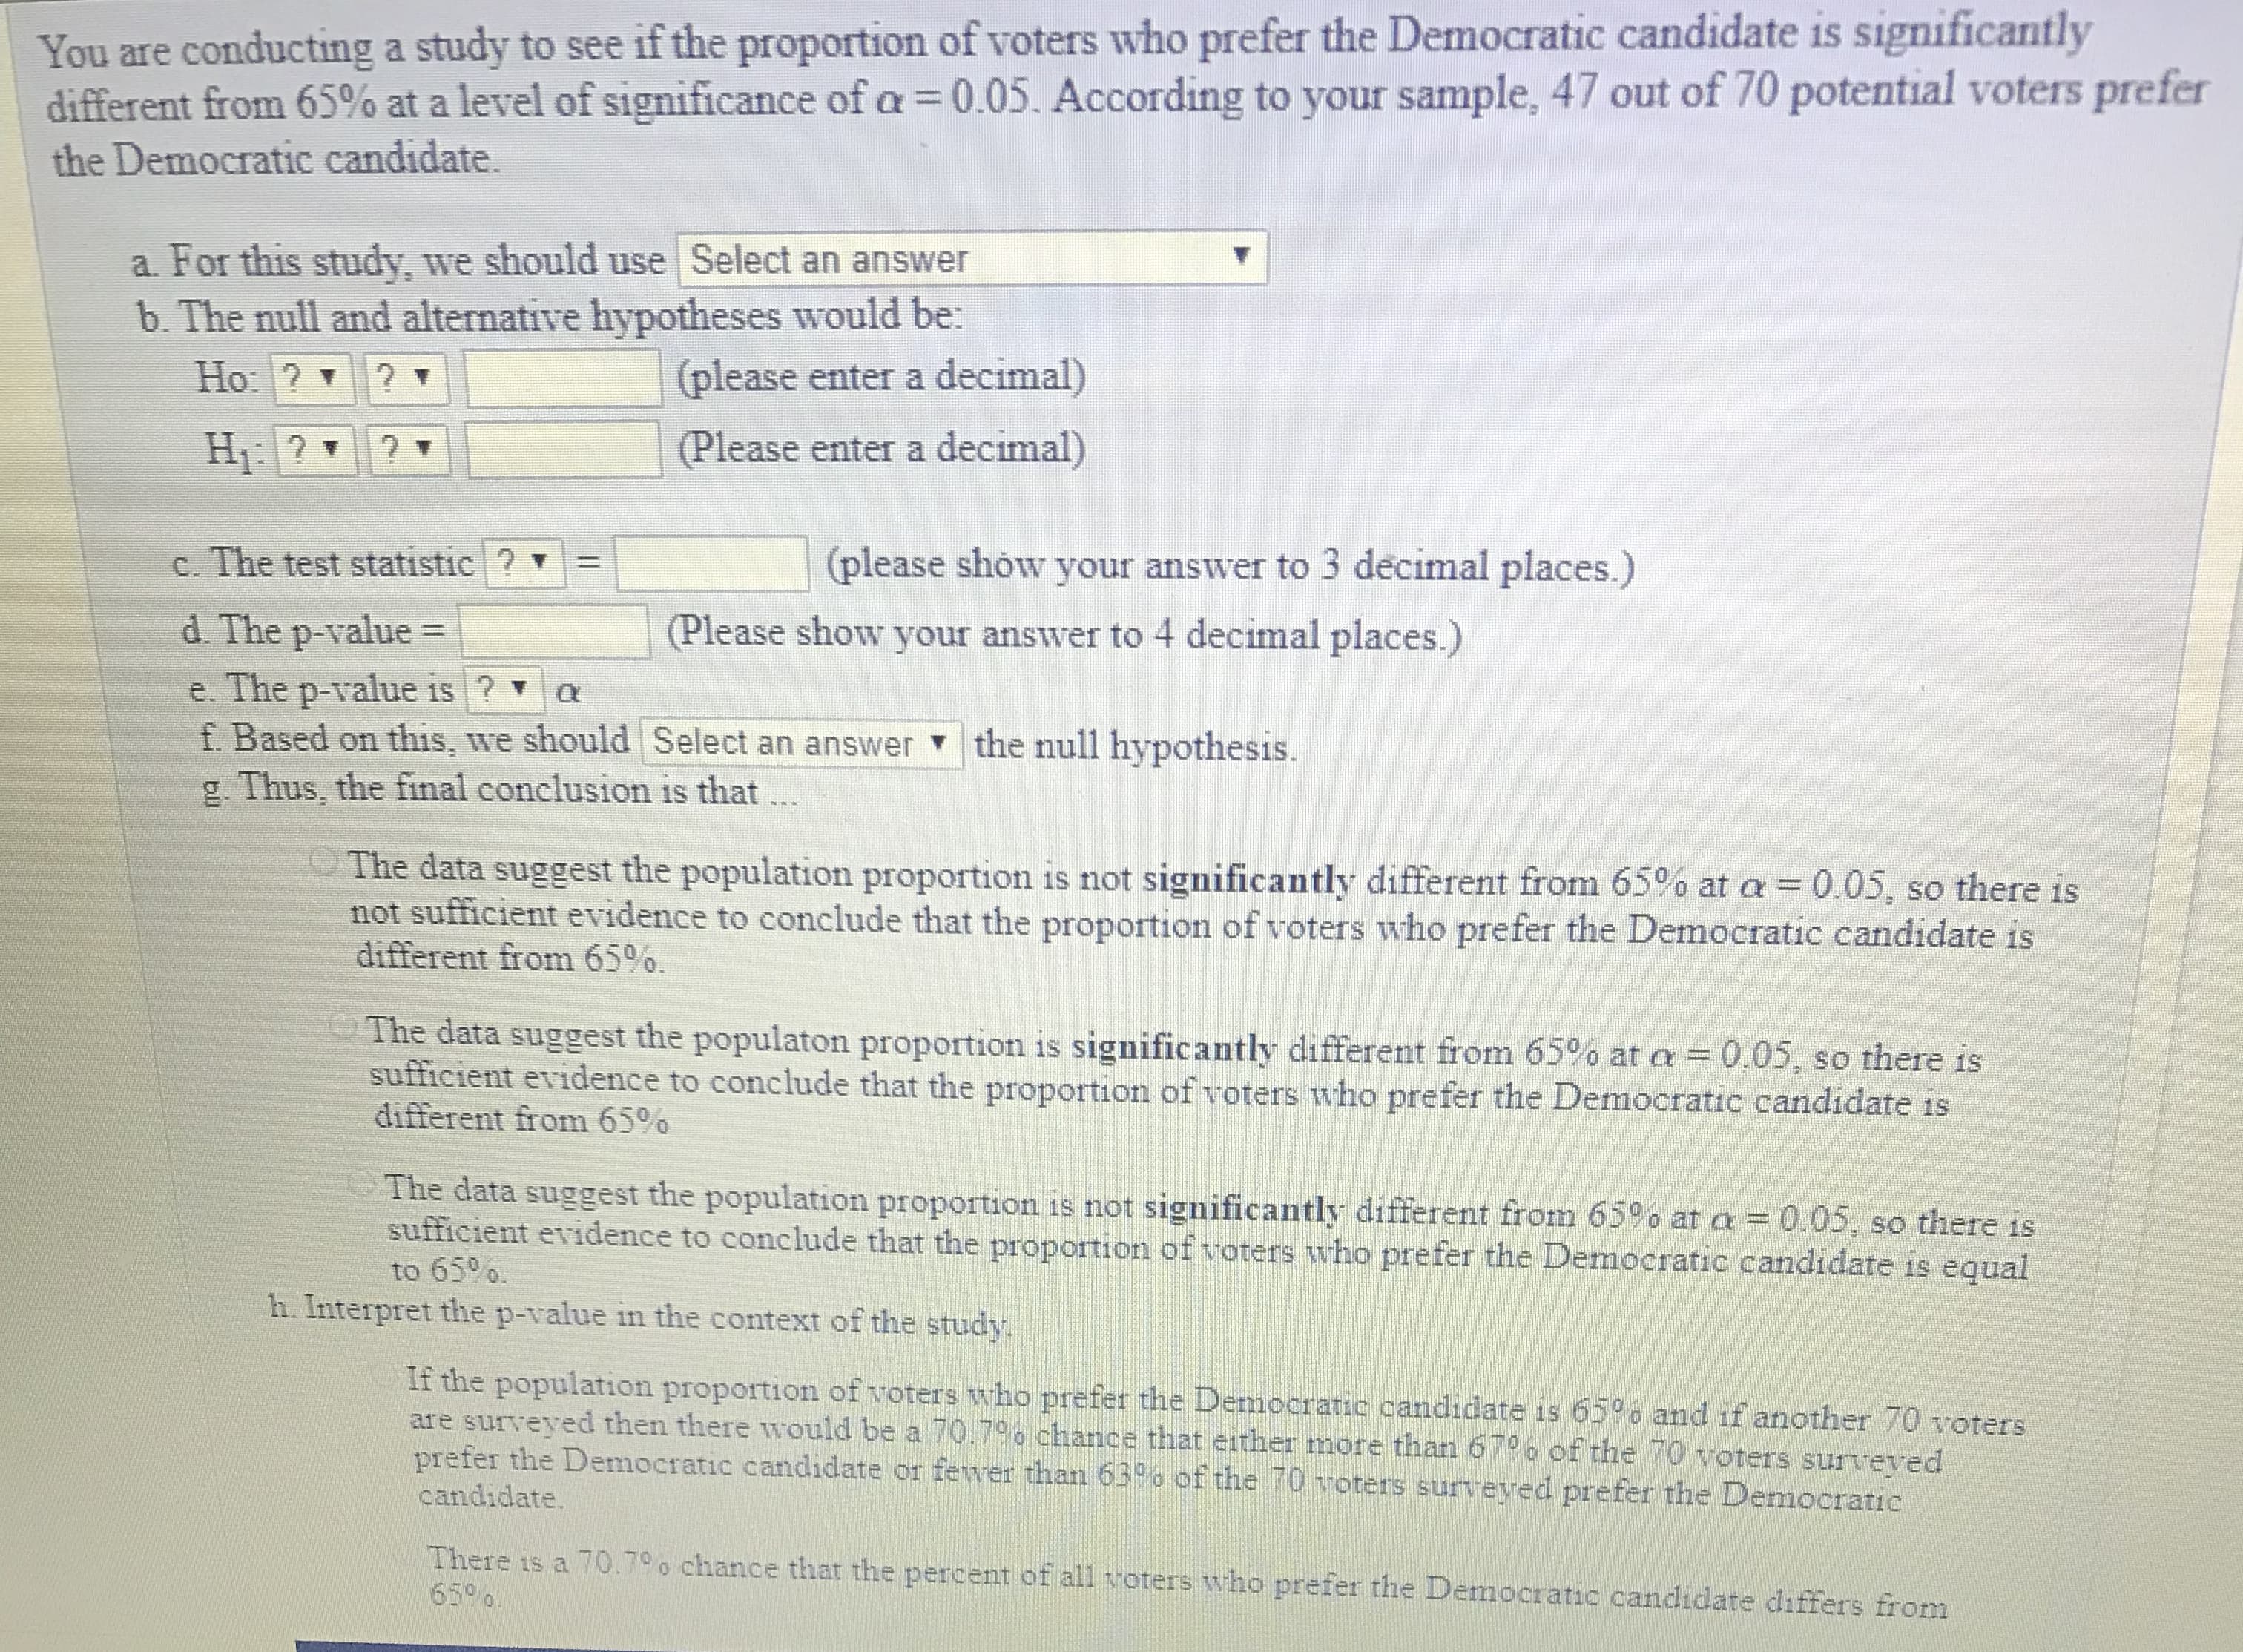
Transcribed Image Text:You are conducting a study to see if the proportion of voters who prefer the Democratic candidate is significantly
different from 65% at a level of significance of α = 0.05. According to your sample, 47 out of 70 potential voters prefer
the Democratic candidate.
a. For this study, we should use Select an answer
b. The null and alternative hypotheses would be:
(please enter a decimal)
Please enter a decimal)
(please show your answer to 3 decimal places.)
c. The test statistic?
d. The p-value
e. The p-value is ?'
f. Based on this, we should Select an answer
g. Thus, the final conclusion is that
Please show your ansver to 4 decimal places)
the null hypothesis.
The data suggest the population proportion is not significantly different from 65% at α-0.05, so there is
not sufficient evidence to conclude that the proportion of voters who prefer the Democratic candidate is
different from 6500.
The data suggest the populaton proportion is significantly different from 65% at a
sufficient evidence to conclude that the proportion of
different from 65%
0.05, so there is
voters who prefer the Democratic candidate is
data suggest the population proportion is not significantly different from 65% at α-0.05, so there is
ufficient evidence to conclude that the proportion of voters who prefer the Democratic candidate is equal
to 65o
h. Interpret the p-value in the context of the study
If the population proportion of voters who prefer the Democratic candidate is 650o and if another 70 voters
are surveyed then there would be a 70.7% chance that either more than 67% of the 70 voters surren ed
prefer the Democratic candidate or fewer than 638o of the 70 voters surveyed prefer the Democratic
candidate
There is a 70.7% chance that the percent of all voters who prefer the Democratic candidate differs from
6500
Expert Solution


Trending now
This is a popular solution!

Step by step
Solved in 9 steps with 6 images

Recommended textbooks for you
MATLAB: An Introduction with Applications
Statistics
ISBN:
9781119256830
Author:
Amos Gilat
Publisher:
John Wiley & Sons Inc

Probability and Statistics for Engineering and th…
Statistics
ISBN:
9781305251809
Author:
Jay L. Devore
Publisher:
Cengage Learning

Statistics for The Behavioral Sciences (MindTap C…
Statistics
ISBN:
9781305504912
Author:
Frederick J Gravetter, Larry B. Wallnau
Publisher:
Cengage Learning
MATLAB: An Introduction with Applications
Statistics
ISBN:
9781119256830
Author:
Amos Gilat
Publisher:
John Wiley & Sons Inc
Probability and Statistics for Engineering and th…
Statistics
ISBN:
9781305251809
Author:
Jay L. Devore
Publisher:
Cengage Learning
Statistics for The Behavioral Sciences (MindTap C…
Statistics
ISBN:
9781305504912
Author:
Frederick J Gravetter, Larry B. Wallnau
Publisher:
Cengage Learning

Elementary Statistics: Picturing the World (7th E…
Statistics
ISBN:
9780134683416
Author:
Ron Larson, Betsy Farber
Publisher:
PEARSON

The Basic Practice of Statistics
Statistics
ISBN:
9781319042578
Author:
David S. Moore, William I. Notz, Michael A. Fligner
Publisher:
W. H. Freeman

Introduction to the Practice of Statistics
Statistics
ISBN:
9781319013387
Author:
David S. Moore, George P. McCabe, Bruce A. Craig
Publisher:
W. H. Freeman