You are conducting a test of independence for the claim that there is an association between the row variable and the column variable.
You are conducting a test of independence for the claim that there is an association between the row variable and the column variable.

Glencoe Algebra 1, Student Edition, 9780079039897, 0079039898, 2018
18th Edition
ISBN:9780079039897
Author:Carter
Publisher:Carter
Chapter10: Statistics
Section10.1: Measures Of Center
Problem 9PPS

Related questions
Topic Video
Question
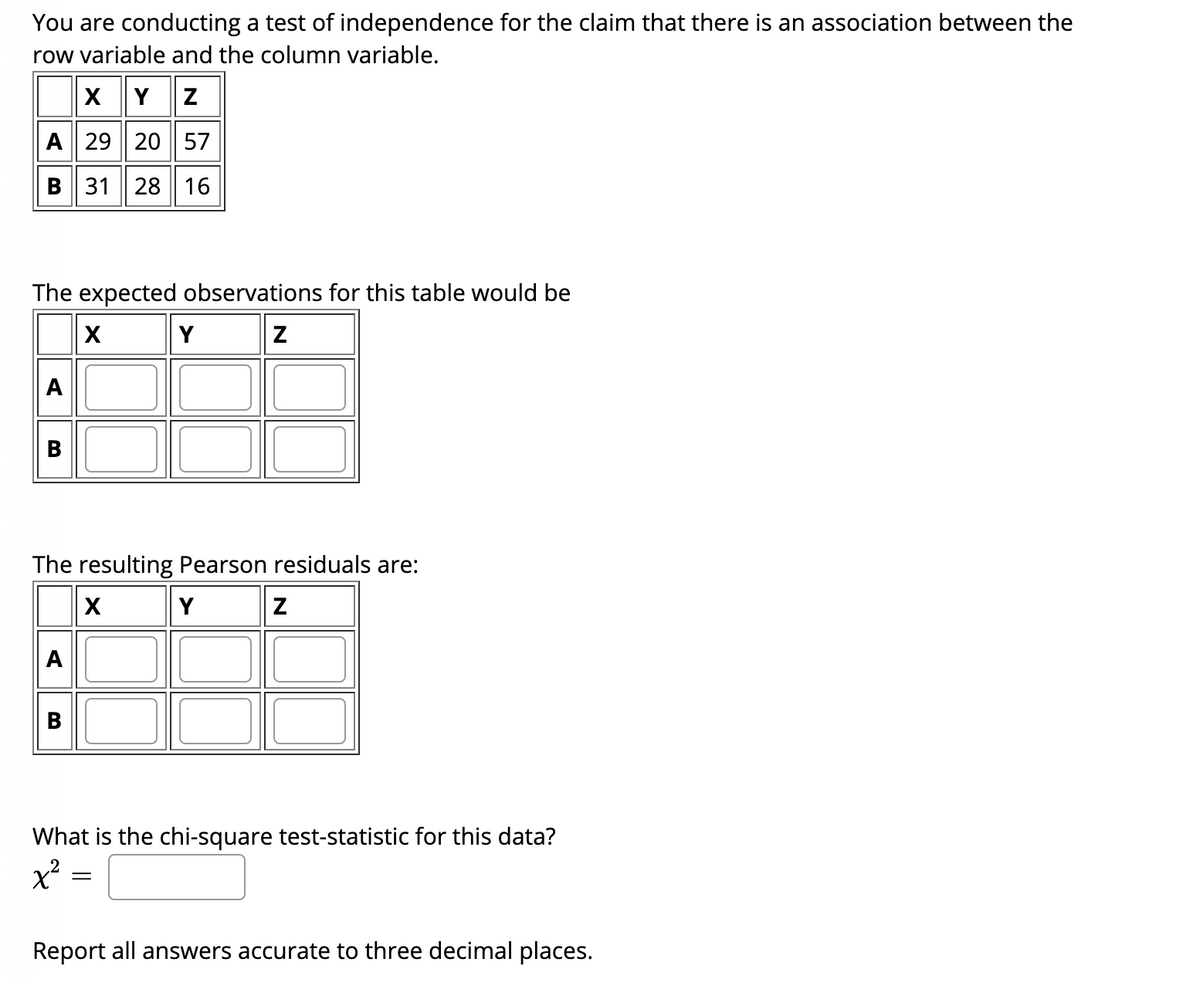
Transcribed Image Text:You are conducting a test of independence for the claim that there is an association between the
row variable and the column variable.
xYZ
A 29 20 || 57
B 31 28 16
The expected observations for this table would be
Y
The resulting Pearson residuals are:
X
Y
What is the chi-square test-statistic for this data?
x²
Report all answers accurate to three decimal places.
Expert Solution
Step 1
- The observed observations are as follows
| X | Y | Z | |
| A | 29 | 20 | 57 |
| B | 31 | 28 | 16 |
Let's find the row and column total.
| X | Y | Z | Total | |
| A | 29 | 20 | 57 | 106 |
| B | 31 | 28 | 16 | 75 |
| Total | 60 | 48 | 73 | 181 |
- Let's find the expected observations.
The formula for expected observation is
For example:
For the A row and X column, the observed observation is 29.
The expected observation would be :
In the same way, the expected value for each cell is as follows.
| X | Y | Z | Total | |
| A | 35.138 | 28.110 | 42.751 | 106 |
| B | 24.862 | 19.890 | 30.249 | 75 |
| Total | 60 | 48 | 73 | 181 |
Hence the expected observation for this table would be:
| X | Y | Z | |
| A | 35.138 | 28.110 | 42.751 |
| B | 24.862 | 19.890 | 30.249 |
Step 2
- The formula for Pearson residual will be as follows.
For example:
For the A row and X column, the observed observation is 29.
The expected observation is 35.138
Then the Pearson residual for A row and X column would be :
In the same way, the Pearson residual for each cell is as follows.
| X | Y | Z | |
| A | -1.035 | -1.530 | 2.179 |
| B | 1.231 | 1.818 | -2.591 |

Trending now
This is a popular solution!

Step by step
Solved in 3 steps

Knowledge Booster


Learn more about
Need a deep-dive on the concept behind this application? Look no further. Learn more about this topic, statistics and related others by exploring similar questions and additional content below.Recommended textbooks for you
Glencoe Algebra 1, Student Edition, 9780079039897…
Algebra
ISBN:
9780079039897
Author:
Carter
Publisher:
McGraw Hill
Glencoe Algebra 1, Student Edition, 9780079039897…
Algebra
ISBN:
9780079039897
Author:
Carter
Publisher:
McGraw Hill