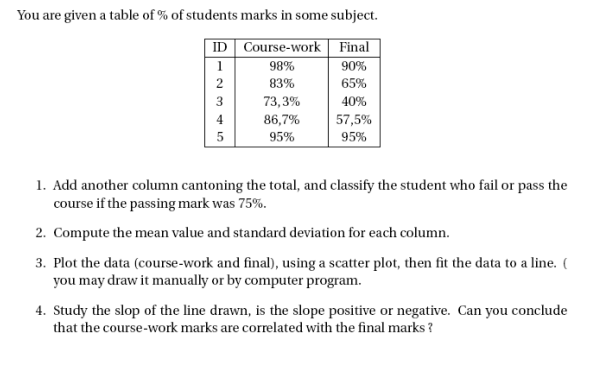
You are given a table of % of students marks in some subject. ID Course-work | Final 90% 98% 2 83% 65% 3 73,3% 86,7% 40% 4 57,5% 5 95% 95% 1. Add another column cantoning the total, and classify the student who fail or pass the course if the passing mark was 75%. 2. Compute the mean value and standard deviation for each column. 3. Plot the data (course-work and final), using a scatter plot, then fit the data to a line. ( you may draw it manually or by computer program. 4. Study the slop of the line drawn, is the slope positive or negative. Can you conclude that the course-work marks are correlated with the final marks ?


Inverse Normal Distribution
The method used for finding the corresponding z-critical value in a normal distribution using the known probability is said to be an inverse normal distribution. The inverse normal distribution is a continuous probability distribution with a family of two parameters.
Mean, Median, Mode
It is a descriptive summary of a data set. It can be defined by using some of the measures. The central tendencies do not provide information regarding individual data from the dataset. However, they give a summary of the data set. The central tendency or measure of central tendency is a central or typical value for a probability distribution.
Z-Scores
A z-score is a unit of measurement used in statistics to describe the position of a raw score in terms of its distance from the mean, measured with reference to standard deviation from the mean. Z-scores are useful in statistics because they allow comparison between two scores that belong to different normal distributions.

Step by step
Solved in 2 steps


