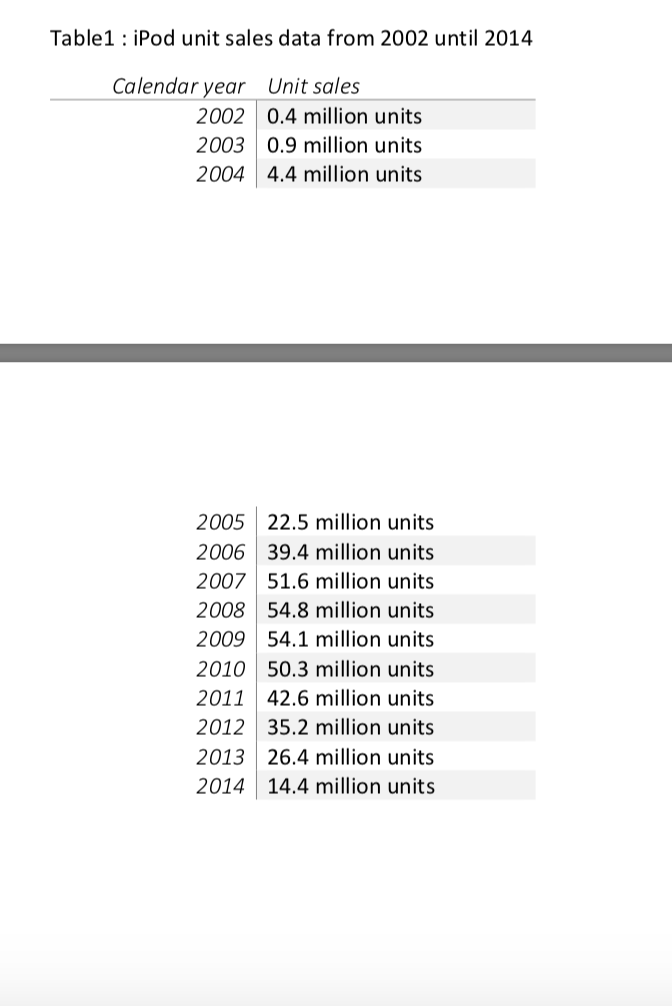
You are given the actual sales volume for iPod, what used to be one of Apple’s popular electronic products. The data covers 12 years of sales data, from 2002 until 2014. Your task is to create a product life cycle graph for the iPod as shown on page 295 of the textbook. The product lifecycle is also available in the lecture slides for Chapter 9. Your life cycle graph should clearly identify the introduction, growth, maturity and declining stages for the iPod. You should show the unit sales in the vertical axis and the calendar years (i.e., time) in the horizontal axis. Once you create the product life cycle graph, answer the following questions: In which years did the maturity stage occurred for the iPod? Explain your reasons in one paragraph of three to five sentences long. In which years did the decline stage occurred for the iPod? Explain your reasons in one paragraph of three to five sentences long.
You are given the actual sales volume for iPod, what used to be one of Apple’s popular electronic products. The data covers 12 years of sales data, from 2002 until 2014. Your task is to create a product life cycle graph for the iPod as shown on page 295 of the textbook. The product lifecycle is also available in the lecture slides for Chapter 9.
Your life cycle graph should clearly identify the introduction, growth, maturity and declining stages for the iPod. You should show the unit sales in the vertical axis and the calendar years (i.e., time) in the horizontal axis. Once you create the product life cycle graph, answer the following questions:
-
In which years did the maturity stage occurred for the iPod? Explain your reasons in one paragraph of three to five sentences long.
-
In which years did the decline stage occurred for the iPod? Explain your reasons in one paragraph of three to five sentences long.

Step by step
Solved in 3 steps with 1 images


