The given table shows the percentage of emails that are sent each day of the business week according to an Intermedia survey. Day Monday Tuesday Percentage 15% 23% Wednesday Thursday Friday 22% 21% 19% Which type of graph best displays this data?
The given table shows the percentage of emails that are sent each day of the business week according to an Intermedia survey. Day Monday Tuesday Percentage 15% 23% Wednesday Thursday Friday 22% 21% 19% Which type of graph best displays this data?

Principles of Economics 2e
2nd Edition
ISBN:9781947172364
Author:Steven A. Greenlaw; David Shapiro
Publisher:Steven A. Greenlaw; David Shapiro
ChapterA: The Use Of Mathematics In Principles Of Economics
Section: Chapter Questions
Problem 3RQ: Exercise A3 What dome slices of a pie chart represent?

Related questions

Question
Q. 1
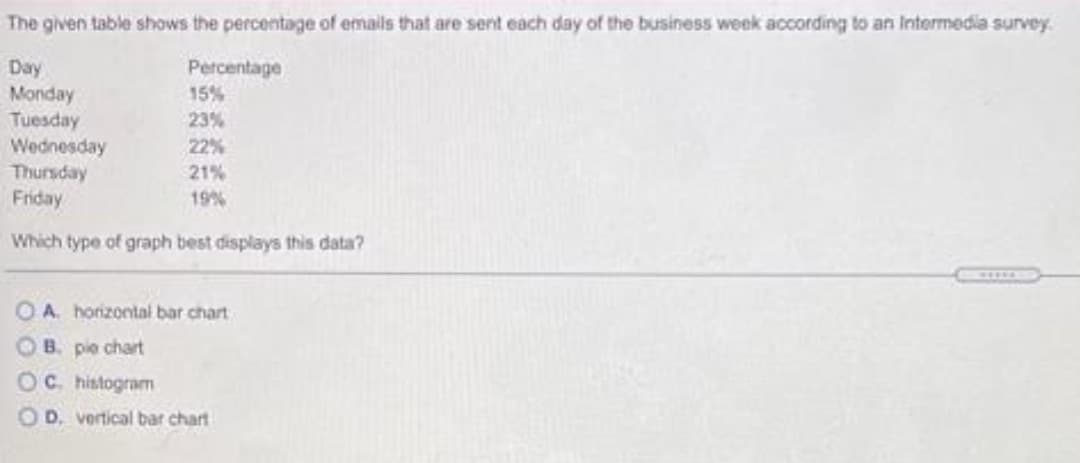
Transcribed Image Text:The given table shows the percentage of emails that are sent each day of the business week according to an Intermedia survey.
Day
Monday
Tuesday
Wednesday
Thursday
Friday
Percentage
15%
23%
22%
21%
19%
Which type of graph best displays this data?
O A. horizontal bar chart
O B. pie chart
OC. histogram
D. vertical bar chart
Expert Solution
This question has been solved!
Explore an expertly crafted, step-by-step solution for a thorough understanding of key concepts.

This is a popular solution!

Trending now
This is a popular solution!

Step by step
Solved in 2 steps

Knowledge Booster


Learn more about
Need a deep-dive on the concept behind this application? Look no further. Learn more about this topic, economics and related others by exploring similar questions and additional content below.Recommended textbooks for you
Principles of Economics 2e
Economics
ISBN:
9781947172364
Author:
Steven A. Greenlaw; David Shapiro
Publisher:
OpenStax


Principles of Economics 2e
Economics
ISBN:
9781947172364
Author:
Steven A. Greenlaw; David Shapiro
Publisher:
OpenStax

Economics (MindTap Course List)
Economics
ISBN:
9781337617383
Author:
Roger A. Arnold
Publisher:
Cengage Learning