You are given the estimated regression equation y=234-6.2X2+082X3 R-Square-0.42 (7.2) (0.95) (0.45) The number between parentheses are standard error the Sample size N=100 The test statistics to test that B2=-5 against the alternative that it is less than -5 is equal to a. -6.526 Ob. -1.263 C. -11.789 O d. None of the option is correct
You are given the estimated regression equation y=234-6.2X2+082X3 R-Square-0.42 (7.2) (0.95) (0.45) The number between parentheses are standard error the Sample size N=100 The test statistics to test that B2=-5 against the alternative that it is less than -5 is equal to a. -6.526 Ob. -1.263 C. -11.789 O d. None of the option is correct

Managerial Economics: Applications, Strategies and Tactics (MindTap Course List)
14th Edition
ISBN:9781305506381
Author:James R. McGuigan, R. Charles Moyer, Frederick H.deB. Harris
Publisher:James R. McGuigan, R. Charles Moyer, Frederick H.deB. Harris
Chapter4A: Problems In Applying The Linear Regression Model
Section: Chapter Questions
Problem 2E

Related questions
Question
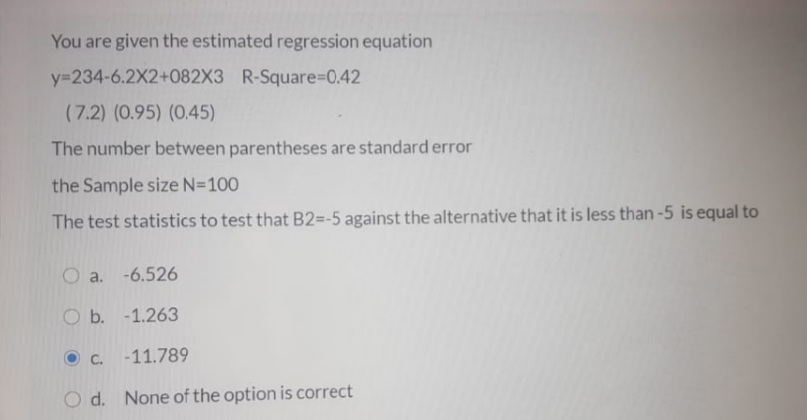
Transcribed Image Text:You are given the estimated regression equation
y=234-6.2X2+082X3 R-Square%-D0.42
(7.2) (0.95) (0.45)
The number between parentheses are standard error
the Sample size N=100
The test statistics to test that B2=-5 against the alternative that it is less than -5 is equal to
O a. -6.526
O b. -1.263
C.
-11.789
d. None of the option is correct
Expert Solution
This question has been solved!
Explore an expertly crafted, step-by-step solution for a thorough understanding of key concepts.

Step by step
Solved in 2 steps

Knowledge Booster


Learn more about
Need a deep-dive on the concept behind this application? Look no further. Learn more about this topic, economics and related others by exploring similar questions and additional content below.Recommended textbooks for you
Managerial Economics: Applications, Strategies an…
Economics
ISBN:
9781305506381
Author:
James R. McGuigan, R. Charles Moyer, Frederick H.deB. Harris
Publisher:
Cengage Learning
Managerial Economics: Applications, Strategies an…
Economics
ISBN:
9781305506381
Author:
James R. McGuigan, R. Charles Moyer, Frederick H.deB. Harris
Publisher:
Cengage Learning