You are given the following claim data for automobile policies: 200 255 295 320 360 420 440 490 500 520 1020 Calculate the smoothed empirical estimate of the 45th percentile. (A) 358 (B) 371 (C) 384 (D) 390 (E) 396
You are given the following claim data for automobile policies: 200 255 295 320 360 420 440 490 500 520 1020 Calculate the smoothed empirical estimate of the 45th percentile. (A) 358 (B) 371 (C) 384 (D) 390 (E) 396

Glencoe Algebra 1, Student Edition, 9780079039897, 0079039898, 2018
18th Edition
ISBN:9780079039897
Author:Carter
Publisher:Carter
Chapter4: Equations Of Linear Functions
Section: Chapter Questions
Problem 8SGR

Related questions
Question
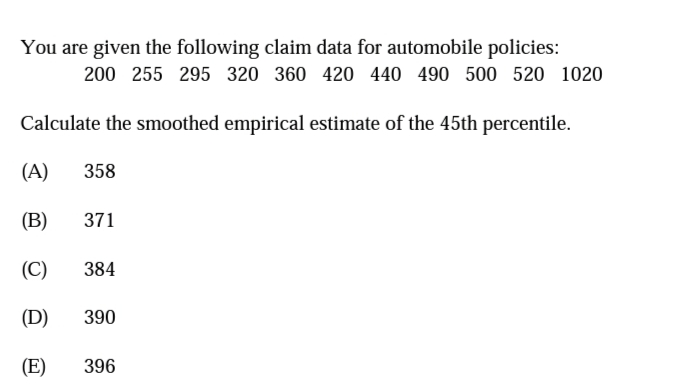
Transcribed Image Text:You are given the following claim data for automobile policies:
200 255 295 320 360 420 440 490 500 520 1020
Calculate the smoothed empirical estimate of the 45th percentile.
(A)
358
(B)
371
(C)
384
(D)
390
(E)
396
Expert Solution
This question has been solved!
Explore an expertly crafted, step-by-step solution for a thorough understanding of key concepts.

This is a popular solution!

Trending now
This is a popular solution!

Step by step
Solved in 2 steps

Recommended textbooks for you
Glencoe Algebra 1, Student Edition, 9780079039897…
Algebra
ISBN:
9780079039897
Author:
Carter
Publisher:
McGraw Hill
Glencoe Algebra 1, Student Edition, 9780079039897…
Algebra
ISBN:
9780079039897
Author:
Carter
Publisher:
McGraw Hill