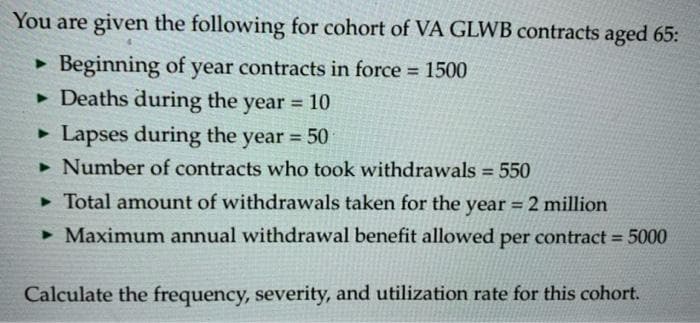
You are given the following for cohort of VA GLWB contracts aged 65: • Beginning of year contracts in force 1500 • Deaths during the year 10 %3D • Lapses during the year 50 • Number of contracts who took withdrawals = 550 %3D • Total amount of withdrawals taken for the year = 2 million %3D • Maximum annual withdrawal benefit allowed per contract = 5000 Calculate the frequency, severity, and utilization rate for this cohort.


Q: Mean wait time. A medical clinic is interested in determining if there is a difference in patients…
A:
Q: The Alpha bank is long in 15 year zero-coupon bond priced at $2 million. The current annual yield on…
A:
Q: For a population with a proportion equal to 0.32,calculate the standard error of the proportion for…
A: For the given data proportion equal to 0.32 ,calculate the standard error of the proportion for…
Q: a. What is the distribution of X? X - N( b. Find the probability that a randomly selected Private…
A: HERE GIVEN, mean = 26477$ standard deviation = 6561$ here X= the cost for randomly selected college…
Q: scores in their technical exam (in percentage). APPLICANT SCORE APPLICANT SCORE 1 Ana 75.2 11 Mia…
A: Solution: The observation in increasing order are 50.5, 58.5, 60.3, 63.3, 63.4, 68.7, 71.2, 74.2,…
Q: A sample of 140is drawn from a population with a proportion equal to 0.57. Complete parts a)…
A:
Q: Determine the degree of freedom, right tailed area, t value Percentile - (4) n - (5) df - 28 Right…
A: Given that df=28 , Right-tailed area=0.10 Find the n , percentile, tcrit
Q: when circuit boards used in the manufacture of computers are tested, the long-run percentage of…
A: Given data : Probability,p = 0.005 number of trial,n = 4
Q: Annual high temperatures in a certain location have been tracked for several years. Let X represent…
A: Given that The given problem is solved using excel regression Excel: data: data analysis:…
Q: Compute the standard deviation for the following sample data. Provide answer up to 3 decimal units…
A: Given: X 32 41 63 24 29 30 40 22 25 37
Q: lustration 11.12. You are given the position in a factory before and after the settlement of an…
A:
Q: The mean cost of a new Sport Utility Vehicle (SUV) has been found to be $42,500 with a standard…
A: Given that X~Normal(μ=42500 , σ = 2500) Formula for Z-score Z-score=(X-μ)/σ
Q: 1. Define mathematical expectation of a random variable. Also define variance, covariance and…
A:
Q: d. What is the difference in the results of (b) and (c)? O A. The probability in part (b) is a joint…
A: d) It is given the sample size is 2000.
Q: Bones Brothers & Associates prepare individual tax returns. Over prior years, Bones Brothers has…
A: Given that μ=90 , σ=27 , n=100
Q: Describe the sampling distribution of p. Assume the size of the population is 30,000. n= 1200, p=…
A:
Q: A national chain of department stores ranks its 900,000 salespeople by the monetary value of their…
A:
Q: Run a regression analysis on the following bivariate set of data with y as the response variable. x…
A: The independent variable is x. The dependent variable is y. We have to predict the explanatory…
Q: Illustration 10.40. You are given the foilowing distributión of monthly income per family. Calculate…
A:
Q: At a local community college, 40% of students who enter the college as freshmen go on to graduate.…
A:
Q: 4. For a linear combination of n random variables, find its expectation and variance.
A:
Q: Illustration 10,39. Suppose that a prospective buyer tests bursting pressure of samples of polythene…
A:
Q: A legislative committee consists of 6 Democrats and 5 Republicans. A delegation of 4 is to be…
A:
Q: A certain vending company's soft-drink dispensing machines are supposed to serve 6 oz of beverage.…
A: There are 5 independent samples which are A, B, C, D and E. We have to test whether there is a…
Q: For the following random samples of scores, test the null hypothesis that the mean of population A…
A:
Q: B) Are these data normally distributed? Use any approach you want but explain why you think this is…
A: We have given that the data set of size 20. Mean = 10.85 Median = 11.02 Mode = 11.02 Range =…
Q: Twenty-five automobiles are sampled to measure gas mileage. The results yielded an average of 26.4…
A: Given that n =25,x bar =26.4,s.d =3.4 Construct a 90% confidence interval for the mean miles per…
Q: If u = 40,0 = 4, what is the raw score which corresponds to z= -2.00? a. 32 b. 44 c. 36 d. 34 What…
A:
Q: Assume that a sample is used to estimate a population proportion p. Find the margin of error M. E.…
A: Given Sample size n=644, sample standard deviations s=7.6, level of significance=0.002, sample mean…
Q: Do college students prefer printed textbooks to electronic textbooks? You work for a textbook…
A: Given: Number Proportion Prefer 28 0.7 Does not prefer 12 0.3
Q: Let X and Y be two continuous random variables with joint probability density function. 12 ... f(x,…
A:
Q: ou wish to determine if there is a positive linear correlation between the two variables at a…
A: Use EXCEL to obtain the value correlation coefficient r: EXCEL procedure: Go to EXCEL Go to…
Q: (On odd number of data) Fit a trend line to the following series by the method of semi averages.…
A:
Q: Your neighbor teaches math at your local elementary school. This week, her students are being…
A: Most commonly used measure of central tendencies are mean, median and mode. These measures of centre…
Q: Refer to the following distribution of ages. Ages 40 up to 50 se up to 60 Frequency 10 28 60 up to…
A: For the given data Find Relative frequency for lowest class = ?
Q: Single Sample t-test. Compute for the z or t value and decide whether to retain or reject the null…
A: A hypothesis which is tested for plausible rejection is called the Null Hypothesis (typically…
Q: 4. The number of rice harvests in kilograms in a certain number of years are 220, 212, 180, 230,…
A: "Since you have asked multiple questions, we will solve the first question for you. If you want any…
Q: Approximately 2 percent of Americans ages 50-60 have lung cancer. A patient with lung cancer has a…
A: It is given that, approximately 2 percent have lung cancer.
Q: Let x be a random variable that represents white blood cell count per cubic milliliter of whole…
A: Let X be the random variable from normal distribution with mean (μ) = 6300 and standard deviation…
Q: The weights (in pounds) of 6 vehicles and the variability of their braking distances (in feet) when…
A: Given: Weight in x Variability in distance y 5960 1.72 5320 1.93 6500 1.88 5100 1.61…
Q: A sample of size n = 10 is drawn from an approximately normal population whose standard deviation is…
A: Givensample Mean(x)=50.9standard deviation(σ)=12.5sample size(n)=10Confidence interval = 99%
Q: Let X and Y have bivariate normal distributions with μX = 70, μY = 80, σ2X = 100, σ2Y = 169, and ρ =…
A:
Q: Refer to the folliowing distribution of ages. Ages 40 up to 50 Frequency 10 50 up to 60 28 60 up to…
A: For the given data class interval =?
Q: Fifteen adult males between the ages of 35 and 50 participated in a study to evaluate the effect of…
A: Given: Sr. No. Before After 1 265 229 2 240 231 3 258 224 4 295 240 5 251 238 6 245…
Q: Learner Height (in meter) Consider the heights of 5 learners. Suppose you are interested in…
A: Solution: Given data
Q: Using the z - table, determine the area under the curve of the indicated region.smaller than -1.06
A: Let Z be the random variable from Normal distribution then we will find the area under the curve of…
Q: Random variables X and Y have the joint PMF with a constant k P(x, y) = {kxy, X = 1,4; y = 1,3…
A: Hello! As you have posted more than 3 sub parts, we are answering the first 3 sub-parts. In case…
Q: a) There are 97% of the cars will be loaded with more than K tons of coal. What is the value of K?…
A: here AS PER GUIDELINES I HAVE CALCULATED 3 SUBPARTS, REPOST FOR REMAINING here given, mean = μ = 75…
Q: Ho:p = 0 H3:p # 0 Identify the critical value(s). Select the correct choice below and fill in any…
A: Given that X Y X \cdot YX⋅Y X^2X2 Y^2Y2 0 37 0 0 1369 1 44 44 1 1936 2 50 100 4…
Q: Illustration 11. From the following series find the 3 yearly and 5-yearly moving averages and draw…
A:

Step by step
Solved in 2 steps

- The management of BCD Inc. would like to separate the fixed and variable components of electricity as measured against machine hours in one of its plants. Data collected over the most recent six months follow:Electricity MachineMonth Cost Hours January $1,100 4,500February 1,110 4,700March 1,050 4,100April 1,200 5,000May 1,060 4,000June 1,120 4,600Required: 1. Using the method of least squares, compute the fixed cost and the variable cost rate for electricity expense. (Round estimates to the nearest cent.) 2. Compute coefficients of correlation and determinationConsider a cohort study to compare the mortality rate of myocardial infarction (MI) in men with sedentary work (exposed group) to men with physically active work (unexposed). If in the exposed, there were 36,000 person (man) years of observation and 126 deaths whereas the unexposed had 24,000 man-years of observation and 44 deaths. Compute the following a) Mortality rate in each cohort? b) What is the relative risk of dying, comparing these 2 groups? c) What is the attributable risk of sedentary work? d) What is the attributable benefit of physical activity? e) If we assume that MI is associated with the mortality in this cohort (causality), what proportion of the disease in the higher group is potentially preventable?The production planning period for flat-screen moni-tors at Louisiana’s Roa Electronics, Inc., is 4 months. Cost data are as follows:Regular-time cost per monitor $ 70Overtime cost per monitor $110Subcontract cost per monitor $120Carrying cost per monitor per month $ 4 For each of the next 4 months, capacity and demand for flat-screen monitors are as follows: PERIOD MONTH 1 MONTH 2 MONTH 3 a MONTH 4Demand 2,000 2,500 1,500 2,100CapacityRegular time 1,500 1,600 750 1,600Overtime 400 400 200 400Subcontract 600 600 600 600aFactory closes for 2 weeks of vacation.CEO Mohan Roa expects to enter the planning period with 500monitors in stock. Back ordering is not permitted (meaning, forexample, that monitors produced in the second month cannot beused to cover first month’s demand). Develop a production planthat minimizes costs using the transportation method.
- Burger Dome sells hamburgers, cheeseburgers, French fries, soft drinks, and milk shakes, as well as a limited number of specialty items and dessert selections. Although Burger Dome would like to serve each customer immediately, at times more customers arrive than can be handled by the Burger Dome food service staff. Thus, customers wait in line to place and receive their orders. Suppose that Burger Dome analyzed data on customer arrivals and concluded that the arrival rate is 45 customers per hour and 1 customer processed per minute. Compare a multiple-server waiting line system with a shared queue to a multiple-server waiting line system with a dedicated queue for each server. Suppose Burger Dome establishes two servers but arranges the restaurant layout so that an arriving customer must decide which server's queue to join. Assume that this system equally splits the customer arrivals so that each server sees half of the customers. How does this system compare with the two-server…Suppose you have been employed by ALADIN Solutions Ltd. as an Operations Manager to study the efficiency of customer service center of SONE Bank in handling customers. The customer service center has two serving points, Alpha and Bravo, through which customers are catered. Your field survey results are presented in Table 1 as follows: Table 1: Wait time of Service Points in Minutes Customer No. Alpha Bravo 1 12 10 2 16 3 3 11 8 4 10 7 5 17 6 6 10 16 7 13 15 8 18 16 9 6 20 10 17 9 You are required to write a letter to your supervisor for presenting the results of your analysis. Use mean waiting times and box plots as the tools to compare the efficiency of Alpha and Bravo serving points. Assuming a customer visits Alpha and Bravo points and is handled in 18 minutes. Which point is handling customer better? Use Z-Score to determine this and incorporate the results in your letter.Suppose you are a production manager for a small firm that manufactures designer phone cases. Your production facility utilizes three machines. Quality is binary — each phone case is either defective or it is not defective. Each hour, Machines 1, 2, and 3 produce 10, 10 and 20 phone cases, respectively. But because the machines differ slightly in their technology, data on past production has shown that they differ in terms of their rates of defective output — specifically, Machines 1, 2, and 3 have rates of defective production of 2%, 4%, and 5%, respectively. If one phone case is selected randomly from one hour’s total output, and that phone case is found to be defective, what is the probability that it was produced by Machine 1? Machine 2? Machine 3?
- In a continuous-time surplus model, the claim severity is distributed as BN(2, 0.4). Determine the Lundberg upper bound for the probability of ultimate ruin if the initial surplus is 2 and the prIn a continuous-time surplus model, the claim severity is distributed as BN(2, 0.4). Determine the Lundberg upper bound for the probability of ultimate ruin if the initial surplus is 2 and the premium loading factor is 0.25.emium loading factor is 0.25.Suppose you have been employed by ALADIN Solutions Ltd. as an Operations Manager to study the efficiency of customer service center of SONE Bank in handling customers. The customer service center has two serving points, Alpha and Bravo, through which customers are catered. Your field survey results are presented in Table 1 as follows: [Total Marks: 05] Table 1: Wait time of Service Points in Minutes Customer No. Alpha Bravo 1 12 10 2 16 3 3 11 8 4 10 7 5 17 6 6 10 16 7 13 15 8 18 16 9 6 20 10 17 9 You are required to write a letter to your supervisor for presenting the results of your analysis. Use mean waiting times and box plots as the tools to compare the efficiency of Alpha and Bravo serving points. [03 Marks] Assuming a customer visits Alpha and Bravo points and is handled in 18 minutes. Which point is handling customer better? Use Z-Score to determine this and incorporate the results…If there is no seasonal effect on people getting sick, we would expect equal numbers of people getting sick in each season (winter, spring, summer and fall). A student takes a census of students who took Marketing Research in 2019 and finds that of the 280 students who took Marketing Research in 2019, 75 were sick in winter, 65 were sick in spring, 68 were sick in summer and 72 were sick in fall. She wonders if the excess in the winter is an indication that sickness rates are not uniform throughout the year. Perform the appropriate chi-square test and indicate the chi-square value below. (Report two decimals)
- Researchers measured the distribution of beak sizes in a cohort of medium ground finch hatchlings in the Galapagos Islands in 1976 just before, and in a cohort of hatchlings two years after a severe drought. They measured 100 finches in each cohort. After the drought, the proportion of large, harder seeds was substantially greater than before the drought. Their data documenting this selective event are shown in graphical and tabular form below. Beak size (mm) Frequency before selection Frequency after selection 10.010.0 0.000.00 0.000.00 10.210.2 0.000.00 0.000.00 10.410.4 0.020.02 0.000.00 10.610.6 0.040.04 0.000.00 10.810.8 0.080.08 0.000.00 11.011.0 0.160.16 0.000.00 11.211.2 0.200.20 0.000.00 11.411.4 0.200.20 0.000.00 11.611.6 0.160.16 0.020.02 11.811.8 0.080.08 0.040.04 12.012.0 0.040.04 0.080.08 12.212.2 0.020.02 0.160.16 12.412.4 0.000.00 0.200.20 12.612.6 0.000.00 0.200.20 12.812.8 0.000.00 0.160.16 13.013.0 0.000.00 0.080.08 13.213.2…The data table shows the yields for a one-year certificate of deposit (CD) and a five-year CD for 13 banks. Complete parts (a) through (c). One-Year CD Five-Year CD 2.47 3.24 3.47 4.78 2.88 4.61 3.64 4.98 2.81 2.75 3.65 3.87 2.86 2.87 3.75 3.69 2.79 2.67 4.14 3.51 4.24 4.76 4.94 4.89 3.31 3.72 a. Compute the first quartile (Q1), the third quartile (Q3), and the interquartile range for a one-year CD.After examining these data for all the jurisdictions, someone notes that certain areas have an unusually high “percent of 18-64 yr-olds with no high school diploma.” Based on this finding, this individual concludes that the high percentages are due to the rising population of immigrants in those areas. Further, the individual argues that any estimates of the associated “percent of low-income working families” in those areas should be recalculated after removing this sub-population from the data set, as they are causing the area to “look bad”. In addition to thinking critically, use the key rules about linear regression and extrapolation to write a statistically appropriate and socially responsible response to the individual’s conclusion and argument.