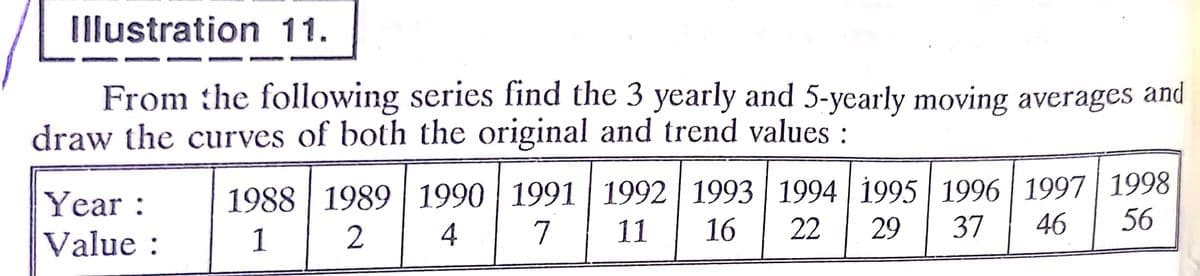
Illustration 11. From the following series find the 3 yearly and 5-yearly moving averages and draw the curves of both the original and trend values : 1988 1989 | 1990 1991 | 1992 | 1993 | 1994 || 1995 | 1996 | 1997 | 1998 16 Year: 2 4 7 11 22 29 37 46 56 Value:


Q: Also Fit a trend line to the following data by the method of semi averages. draw the curve for both…
A:
Q: A sales manager wants to forecast monthly sales for the company's products using the following…
A: Given information: The data represents the monthly sales data.
Q: Which of the following statements about time-series forecasting m is TRUE? Check all that apply. O…
A: Time series forecasting: It is used to make scientific predictions based on historical time stamped…
Q: From the following data fit a free hand smooth curve and forecast the trend values thereby.…
A:
Q: In a recently conducted study, families reported using an average of 70 gallons of gasoline per…
A:
Q: To determine this, you test the following hypotheses: Select one: H0:p1=p2 vs Ha:p1p2 H0:p1=p2…
A: From the given data Option (4) is correct to test the hypothesis ie, Null hypothesis:H0:p1=p2…
Q: Refer to the following frequency distribution of days absent during a calendar year by employees of…
A: For the given data How many employees were absent 6 up to 12 days
Q: The average production cost for major movies is 58 million dollars and the standard deviation is 20…
A:
Q: Illustration 11.2. Find the skewness from the following data: TABLE 11.2 Height (in inches) Number…
A:
Q: Is there a difference in the amount of airborne bacteria between carpeted and uncarpeted rooms? In…
A: We need to test, if there is any difference in the amount of airborne bacteria between carpeted and…
Q: Sixty-four semi trucks are weighed at a highway weigh station from an unknown population. The…
A:
Q: Illustration 12,5. Fit a straight line trend to the data given here by the method of least squares:…
A:
Q: rocket motor is manufactured by bonding together two types of propellants, an igniter and a…
A: Given that By using excel regression
Q: INSTRUCTION: Make your own problem and solve. Use your assigned numbers as given figures. Encircle…
A: “Since you have asked multiple question, we will solve the first question for you. If you want any…
Q: 1. Determine the zerit value. 2. Calculate the mean (M) length of jail time for the sample. 3.…
A: Here given for the prison time of 16 sample Here Population mean =5.2 years Population standard…
Q: Here is a bivariate data set. x y 70.8 7 70.6 75.5 77.9 25.7 59.8 46.4 65.4 85.8 72.5 70.6 71.2…
A: Here is a bivariate data set. x y 70.8 7 70.6 75.5 77.9 25.7 59.8 46.4 65.4 85.8…
Q: local video store wishes to determine the average age of its clients. They conduct a survey of 100…
A:
Q: 7. Gregorian Dates (e.g. October 4, 2016) O RATIO INTERVAL ORDINAL O NOMINAL
A: We have given that the level of measurements of data type. Note: According to Bartleby expert…
Q: The data in PROMIS shows that the average age of the teachers in PHS is 36 years and the standard…
A: As per our guidelines we can solve first three sub part of question and rest can be reposted.…
Q: QUESTION FOUR An investor in a bank's trust department thinks that in 100 days the price of gold…
A: Given that - An investor in a bank's trust department thinks that in 100 days the price of gold will…
Q: A study found that the mean amount of time cars spent in drive-throughs of a certain fast-food…
A:
Q: The manager of a certain bank has recorded the amount of time, recorded to the nearest tenth of a…
A: R code: Output:
Q: Provided below are summary statistics for independent simple random samples from two populations.…
A:
Q: You may need to use the appropriate appendix table or technology to answer this question. Consider…
A: µ = 23 µo = 20…
Q: Illustration 10.40. You are given the foilowing distributión of monthly income per family. Calculate…
A:
Q: Suppose a random sample of n= 320 teenagers 13 to 17 years of age was asked if they use social…
A:
Q: The following bivariate data set contains an outlier. x y 108.4 4170.3 83.2 1105.2 95.4 -1398.9 58.3…
A: To see the outlier we create scatter plot of the given data set. We represents the values of X on X…
Q: The Florida Department of Transportation (FDOT) would like to estimate the average speed of vehicles…
A: For the given data s..d =7,alpha=0.1 M.E =? C.I =?
Q: Calculate the mean for this population. μ= enter your response here (Type an integer or a…
A: Since you have posted a question with multiple sub-parts, we will solve first three subparts for…
Q: 2. The United States Census uses world population information to model population growth. The table…
A: Hello thank you for the question. According to our honor code can answer only three sub parts at a…
Q: We have data on the lean body mass and resting metabolic rate for 12 women who are subjects in a…
A:
Q: HA = 0.321 (Round to three decimal places as needed.) Determine the standard deviation of the…
A: Solution-: Given: N=30000,n=1200,p=0.321 We find, (a) μp^=? (b) σp^=?
Q: 1. Show that B, and B are unbiased estimators of the true parameter ß. 2. Show that B1 is a linear…
A: Note: As per company guidelines only one question can be answered at a time. Kindly, resubmit the…
Q: Listed below are the times (in minutes) it took a sample of students to complete a statistics test.…
A: The random variable time follows normal distribution. We have to test whether students spend 40…
Q: Calculate the 3 yearly and 5 yearly moving averages for the following time series :
A: here use 3 yearly and 5 yearly moving average formula for 3 year moving average Ft = At-3 +At-2…
Q: A sample of n = 14 observations is drawn from a normal population with u = 1090 and o = 170. Find…
A:
Q: Let X and Y be two continuous random variables with joint probability density function. 12 ... f(x,…
A:
Q: Which graphs are best for showing central tendency and spread of data. Stem & Leaf O Histogram Pie…
A: option (D) BOXPLOT Whenever you have consistent factors that are separated into gatherings, you can…
Q: You are an econometrician working in the Ministry of Finance in Trinidad and Tobago and using a…
A: Since you have asked multiple question, we will solve the first question for you. If you want any…
Q: For an M/M/1 queue with load p, prove that : E[NQ] = and Var(N): (1 – p)²
A:
Q: Data Management - Organization of Data for analysis The population of a school has the following…
A: Multistage sampling is a type of sampling technique that is often called modified cluster sampling.
Q: Illustration 10.44. A calculating machine.while calculating mean and standard deviation of 25…
A: n=25, σ=5, x̄=30
Q: If a test statistic does not lie in the critical region, we should the null hypothesis.
A: Rejection Rule: IF the test statistic value lies within the critical region, then reject the null…
Q: 1. Sharon, a data analyst for the municipality of Mariveles, Bataan, is interested in studying the…
A: Given that Sharon, a data analyst for the municipality of Mariveles. Bataan, is interested in…
Q: Suppose the Federal Aviation Administration (FAA) would like to compare the on- time performances of…
A:
Q: Suppose the grade distribution of midterm scores in a large lecture course is as follows: 25% A, 30%…
A: Assume that p is the true population proportion of students, who got C or better.
Q: A machine that fills beverage cans is supposed to put 16 ounces of beverage in each can. Following…
A: Given Population mean μ=16
Q: What is the variance and standard deviation for profit? Fill out the table below to help you…
A:
Q: The number of hours 10 students spent studying for a test and their scores on that test are shown in…
A: Given significance level is 0.05. Number of pairs is n=10. df=n-2=10-2=8
Q: Use the computer output to estimate the intercept β0 and the slope β1.
A: We have given that The regression equation is Y^ = 26.4 + 4.10X

Step by step
Solved in 3 steps with 3 images

- Table 4 gives the population of a town (in thousand) from 2000 to 2008. What was the average rate of change of population (a) between 2002 and 2004, and (b) between 2002 and 2006?Table 3 gives the annual sales (in millions of dollars) of a product from 1998 to 20006. What was the average rate of change of annual sales (a) between 2001 and 2002, and (b) between 2001 and 2004?Table 6 shows the year and the number ofpeople unemployed in a particular city for several years. Determine whether the trend appears linear. If so, and assuming the trend continues, in what year will the number of unemployed reach 5 people?
- For questions 1 and 2, you need to draw and shade the distribution curves.The accompanying histogram is for pulse rates for 125 people. Convert the vertical axis to relative frequency and shows the values that would replace each of the values on the vertical axis.ILLUSTRATION 22. Two brands of tyres are tested with the following results: life(in 1000 miles) Brand of tyres X Y 20-25 1 0 25-30 22 24 30-35 64 76 35-40 10 0 40-45 3 0 Question 1. Which brand of tyres between x and y have greater average life? Question 2. Compare the variability and the state of which the brand of tyres would use on your trucks?
- The following ACF plots were produced for raw data of monthly sales of two different variables, A and B. Explain in detail which variable (A or B) is likely to be easier to forecast.The table gives the population in a small coastal community for the period 1997 - 2006. Figures shown are for January 1 each year. Year Population 1997 624 1998 856 1999 1,336 2000 1,578 2001 1,591 2002 1,483 2003 994 2004 826 2005 801 2006 745 (a) What was the average rate of change of population between 1999 and 2002?(b) What was the average rate of change of population between 2003 and 2005?(c) For what period of time was the population increasing? The population was increasing from until . (d) For what period of time was the population decreasing? The population was decreasing from until .The MAD for the forecast developed using a weighted 2-year moving average with weights of 0.350.35 and 0.650.65 is what?
- A used car company believes that there is a relationship between the amount spent on advertising and its sales. Data collected for 6 years are as follow: Amount spent on advertising Sales ($thousands) ($millions) 2.0 1 3.0 3 2.5 4 2.0 2 2.0 1 3.5 7 1. Illustrate the above on a scatter plot.John Kittle, an independent insurance agent, uses a five-year moving average to forecast the number of claims made in a single year for one of the large insurance companies he sells for. He has just discovered that a clerk in his employ incorrectly entered the number of claims made four years ago as 1,400 when it should have been 1,200.a. What adjustment should Mr. Kittle make in next year’s forecast to take into account the corrected value of the number of claims four years ago?b. Suppose that Mr. Kittle used simple exponential smoothing with a = .2instead of moving averages to determine his forecast. What adjustment is now required in next year’s forecast? (Note that you do not need to know the value of the forecast for next year in order to solve this problem.)Compare the two groups (male and female students) in terms of their measures of location and measures of dispersion. On the average, which group of students perform academically better in the previous term? Which group varies more?
