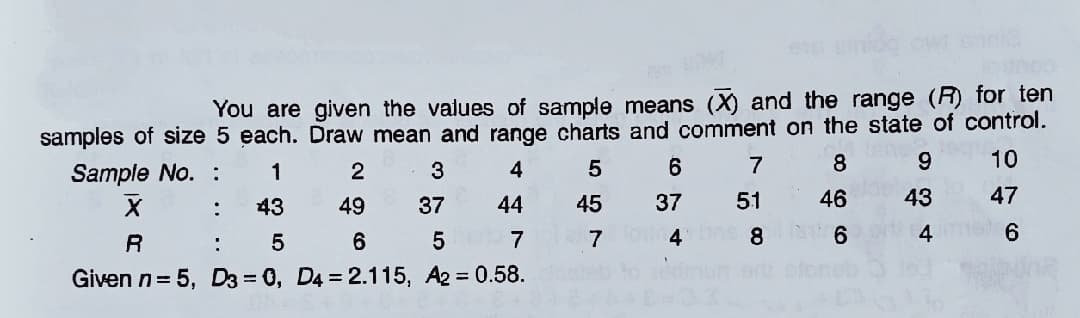
You are given the values of sample means (X) and the range (R) for ten samples of size 5 each. Draw mean and range charts and comment on the state of control. 10 Sample No. : 1 2 7 8 9. 43 49 37 44 45 37 51 46 43 47 5 6. 7 7 8 6. 4 : Given n= 5, D3 = 0, D4 = 2.115, A2 = 0.58. 4.


Q: The accuracy of a coin-counter machine is gauged to accept nickels with a mean diameter of millimete...
A:
Q: 4. A die is rolled 100 times with the following distribution: Humber 1 2 3 4. Observed frequency 17 ...
A: Given that A die is rolled 100 times The following table is given : Number 1 2 3 4 5 6 Obse...
Q: 1. Consider a heterogeneous labor economy with a population L = 100. The raw productivity z of indiv...
A:
Q: The mgf. of a r.v. X is (}+3) (+e) . Show that 9-x Ρ(μ- 2σ<X<με 20 - Σ (!) ( (3) P (μ- 2σ< <μ+ 20-Σ(...
A:
Q: The state of California has a mean annual rainfall of 22 inches, whereas the state of New York has a...
A: Given: For California: Mean,μ=22Std deviation,σ=4Sample size, n=30 For New York: Mean,μ=42Std deviat...
Q: A random sample of 5000 taxpayers was selected and the amount of their 2018 tax refund was recorded....
A:
Q: The mean age at first marriage in the U.S. is 28. A random sample of 626 married residents of New Yo...
A: Sol: Given, Sample size = 626 Sample mean = 27.7 Standard deviation = 2.9 Population mean = 28
Q: Commodities 8. Given the data in the adjoining Table, where p and q respectively stand for price and...
A:
Q: Question Percentage of a population that uses a social media The accompanying table contains the per...
A: Given: Sr. No. Data 1 5 2 6 3 16 4 19 5 25 6 28 7 29 8 32 9 36 10 37 11 ...
Q: The prices of agricultural commodities for 1946-47 and for the inonth of Dece:mber 1950 are given be...
A:
Q: A school feacher wanted to examine whether pass rates increased as students had more time to study. ...
A: Using given data, sample size (n)=20Pass rate in surprise exam(x1)=2Pass rate in final exam(x2)=12Pr...
Q: Male and female populations of humpback whales under 80 years old are represented by age in the tabl...
A: Formula for mean and standard deviation Mean=∑f⋅x/n Standard deviation=√((∑f⋅x2-(∑f⋅x)2/n)/n) Note:...
Q: The following data shows how many employees showed up to work every day for two weeks 12 18 09 16 11...
A: We have given that data I want to find interquartile mean and standard deviation. Interquartile ra...
Q: The mean age at first marriage in the U.S. is 28. A random sample of 626 married residents of New Yo...
A:
Q: 6. Television station ABC wants to know the proportion of TV owners in Metro Cebu who watch the stat...
A: “Since you have asked multiple questions, we will solve the first question for you. If you want any ...
Q: X Question 16 player of a video game is confronted with a series of 3 opponents and a(n) 70% probabi...
A:
Q: The weather in Rochester in December is fairly constant. Records indicate that the low temperature f...
A: Let X be the temperature from uniform distribution with a = 15 ans b = 35
Q: traffic lights on the route. Let X denote the number of red lights the truck encounters going from A...
A:
Q: ng that a study on risk management practices among 848 entrepreneurs is being made and some of the q...
A: Given: Number of entrepreneurs = 848 Number of questions asked = 6
Q: URN PROBLEM. How can 5 black and 5 white balls be put into two urns to maximize the probability a wh...
A:
Q: x < 0 0 < x < 1 F (x) 3x 2 1
A: Let x be the Continuous random variable having cumulative distribution function F(x)
Q: a. Compute the first quartile (Q,), the third quartile (Q), and the interquartile range. Percentage ...
A: Solution-: We find, (a) Q1 , Q2 and IQR (b) List the five number summary (c) Construct the boxplot a...
Q: Giving a test to a group of students, the grades and gender are summarized below B Total Male 12 20 ...
A: Given that. A B C Total Male 6 2 12 20 Female 16 15 7 38 Total 22 17 19 58 Note: Acc...
Q: . In an introductory statisties class of 50 students, there are 11 freshman, 19 sophomores, 14 junio...
A: Given: In an introductory statistics class of 50 students, there are 11 freshman, 19 sophomores, 14 ...
Q: Consider a radar system that uses radio waves to detect aircraft. The system receives a signal and, ...
A:
Q: The mean age at first marriage in the U.S. is 28. A random sample of 626 married residents of New Yo...
A:
Q: For each measure below, indicate which kinds of reliability would need to be evaluated. Then draw a ...
A: Reliability refers to the measures that are used in experimenting with research so that the conclusi...
Q: Test the claim that the proportion of people who are confident is smaller than 90% at the 0.025 sign...
A: A well-known brokerage firm executive claimed that 90% of investors are currently confident of meeti...
Q: 5. Let x denote the time taken to run a road race. Suppose x is approximately normally distributed w...
A: We have given that. X~N( μ , ?^2 ) μ = 190, ? =21 Z-score =( x - μ )/?
Q: Atlantic Airways flights were late (arrived or departed 15 minutes late or more). A random sample of...
A: We have given that Number of trials n=140 Success of probability p =20.4%=0.204 We use normal appro...
Q: Using historical records, the personnel manager of a plant has determined the probability of X, the ...
A:
Q: The prior probabilities for events A1, A2, and A3 are P(A1) = 0.10, P(A2) = 0.60, and P(A3) = 0.30. ...
A: Given handwritten solution
Q: Two cards are drawn (a) successively with replacement -(b) simultaneously (successively without repl...
A:
Q: Example Find the density function f (x) corresponding to the characteristic function defined as foll...
A:
Q: Automobile racing, high-performance driving schools, and driver education programs run by automobile...
A: For the provided data of "weight" and "price", the scatter plot is to be plotted by taking the indep...
Q: Example 17-34. Let x1, x2, ..., x, denote random sample of size n from a uniform population with p.d...
A:
Q: Example 8-16. Show that for p probability at X =n, if n is even, and at X = 5 (n – 1) as well as X =...
A:
Q: How can I view boxplots and histogram on ti83
A: The TI-83 is a series of graphing calculators manufactured by Texas Instruments. The original TI-83 ...
Q: A random variable X has the following pdf: f(x) = 9xe-3";x > (a) Calculate the expected value of the...
A: Let X be a continuous random variable taking values in interval -∞,∞ with probability density functi...
Q: Find the coefficient of skewness from the tollowing intormation : Difference of two quartiles = 8 Mo...
A:
Q: Homework #3: Discrete Markov chains 1. In small town there are three different types of whether cond...
A:
Q: d) Identify a quantitative variable that might be of interest. e) Is the proportion of viewers in th...
A: Here given, Television station ABC wants to know the proportion of TV owners in Metro Cebu who watc...
Q: Eamings per share. The earnings per share (in dollars) for 12 companies selected at random from the ...
A: The number of observations is 12.
Q: 2.2 Roulette wheel: The game of roulette involves spinning a wheel with 38 slots: 18 red, 18 black, ...
A: Given : No. of Red balls =18 No. of Black balls = 18 No. of Green balls = 2 Definition : Prob of an ...
Q: With regard to Laspeyre's and Paasche's price index numbers, it is maintained that, "If the prices o...
A:
Q: Dominique, Clarice, and Marco work for a publishing company. The company wants to send two employees...
A:
Q: Please do STEP 2 only. STEPS IN THE SAMPLING PROCESS: Define the population from which the sample ...
A: 2. A pop. frame is a list of units in the target pop..
Q: The average battery life of the iPhone X is reported to be 11 hours by appleinsider.com. Assume that...
A:
Q: 4. Cebu Technological Corporation manufactures computer monitors. The following data give the number...
A: The data of number of monitors produced at the company for 30 days are given as: 24, 32, 27, 23, 33,...
Q: Let T be the time that is needed for a specific task in a factory to be completed. In order to estim...
A:

Step by step
Solved in 2 steps

- The tests of assumptions for yield gave values for Levene’s statistic and Shapiro-Wilk’s as 0.0562 and .00271, respectively. At a=0.05 , which statistical test is most appropriate to compare the yield among the nitrogen rates? a. Cochran’s Q B. Friedman’s C. Kruskal Wallis test . D. Anova F-testA horticulture student is interested on the antifungal properties of three plant species. Leaf extracts from each species were mixed with agar based growth medium and poured into 5 Petri dishes. The Petri dishes were streaked with fungi isolates and the area in sq mm of fungal growth was measured after seven days. Assuming the areas of growth are not normally distributed, which is the most appropriate analysis for the experiment to find difference? A. Kruskal Wallis B. Friedman C. t-test D. sign testLet ?1 denote true average tread life for a premium brand of P205/65R15 radial tire, and let ?2 denote the true average tread life for an economy brand of the same size. Test H0: ?1 − ?2 = 5000 versus Ha: ?1 − ?2 > 5000 at level 0.01, using the following data: m = 45, x = 42,100, s1 = 2400, n = 45, y = 36,200, and s2 = 1800.Calculate the test statistic and determine the P-value. (Round your test statistic to two decimal places and your P-value to four decimal places.) z = P-value = State the conclusion in the problem context. Fail to reject H0. The data does not suggest that the difference in average tread life exceeds 5000.Reject H0. The data suggests that the difference in average tread life exceeds 5000. Fail to reject H0. The data suggests that the difference in average tread life exceeds 5000.Reject H0. The data does not suggest that the difference in average tread life exceeds 5000.
- Let ?1 denote true average tread life for a premium brand of P205/65R15 radial tire, and let ?2 denote the true average tread life for an economy brand of the same size. Test H0: ?1 − ?2 = 5000 versus Ha: ?1 − ?2 > 5000 at level 0.01, using the following data: m = 45, x = 42,100, s1 = 2400, n = 45, y = 36,200, and s2 = 1800. Calculate the test statistic and determine the P-value. (Round your test statistic to two decimal places and your P-value to four decimal places.) z = P-value = State the conclusion in the problem context. Fail to reject H0. The data does not suggest that the difference in average tread life exceeds 5000.Reject H0. The data suggests that the difference in average tread life exceeds 5000. Fail to reject H0. The data suggests that the difference in average tread life exceeds 5000.Reject H0. The data does not suggest that the difference in average tread life exceeds 5000.A z-score of –1.6 has a corresponding Stanine score of:You need to test whether the average mealtime spending of American tourists (population 1) is greater than that for British tourists (population 2). Assume that you have a sample of n1=7 with sample mean X1=40 and a sample standard deviation of S1=6, and you have an independent sample of n2=16 from another population with a sample mean of X2=31 and sample standard deviation S2=5. Complete parts (a) to (d). Click here to view page 1 of the table of the critical values of t. LOADING... Click here to view page 2 of the table of the critical values of t. LOADING... a. What is the value of the pooled-variance t test statistic for testing? t=enter your response here (Type an integer or a decimal rounded to two decimal places as needed.) b. In finding the critical value of the test statistic t, how many degrees of freedom are there? There are enter your response here degrees of freedom. c. Using a significance level of α=0.01, what is the critical value for a…
- The diameter of a metal shaft used in a disk-drive unit is normally distributed with mean 0.2508 in. and std. dev. 0.0005 in. The specification on the shaft have been established as (0.25-0.0015 in, 0.25+0.0015in) If the process mean has been adjusted to 0.25 in, what fraction of the shafts produced does NOT conform to specifications? a). 0.0027 b). 0.0013 c).0.08 d). 0.16Your company manufactures plastic wrap for food storage. The tear resistance of the wrap, denoted by X, must be controlled so that the wrap can be torn off the roll without too much effort but it does not tear too easily when in use. In a series of tests (see data table below), 15 rolls of wrap are made under carefully controlled conditions and the tear resistance of each rool is measured. The results are used as the basis of a quality assurance specification. If X for a subsequently produced roll falls more than two standard deviations away from the test period average, the process is declared out of specification and production is suspended for routine maintenance. Roll 1 2 3 4 5 6 7 8 9 10 11 12 13 14 15 X 134 131 129 133 135 131 134 130 131 136 129 130 133 130 133 a)What is the mean tear resistance? Enter your answer to the correct number of significant figures. b)What is the…As a bonus assignment a former student checked if your professor gave a statisticallysignificant difference in grades between his male and female students. She based herstudy based on grades assigned in intermediate Econ courses (Econ 303, 305 and 317)and her sample included nm = 485 male students and nf = 264 female students. Theaverage grades received were xm = 84.6 and xf = 85.8 The population standad deviation were σ m = 12.0 and σ f = 11.4 8. From the same extra-credit study as in question 7 see above, this former student found that the proportion of female students in principle courses (Econ 203, 205) was ?̅? = 0.380, while the proportion of female students in intermediate courses (Econ 303, 305, 317) was ?̅? = 0.352. The principle courses sample size was np = 782, while the intermediate courses sample size was ni = 749. Test the hypothesis that female students are less in intermediate courses using a 90% confidence level and the p-value approach.
- The following data are values of pressure (psi) in a torsion spring for several settings of the angle between the legs of the spring in a free position. Also presented is the ANOVA result.a.1. Solve for the Bartlett’s computed value. a.2. Solve for the Bartlett’s critical value using α = 0.01. a.3. Conclude if the variances are equal.A sample is counted for 10 minutes and results in 530 gross counts. A 30-minute background count results in 1,500 counts. The detector efficiency is 0.10 cpm/dpm. What is the critical level (net count rate) that corresponds to a risk of making a Type I error, where α is 0.05? a. 3.0 cpm b. 4.2 cpm c. 50 cpm d. 53 cpmA metal company is supplying its product to a manufacturer of washing appliances that has specified that the outside diameter be 0.255 + 0.028 inch. Fifty samples of n = 5 units show that the process is in good statistical control, the diameters are normally distributed, and that μx and σx for the process are 0.260 and 0.02 inch, respectively. a) What percent of the product made by this process is within the specifications? Answer in 2 decimal placesb) If the process variability was reduced by about half (i.e., σx changed to 0.01 inch), what percent of the product made by this process is within the specifications? Answer in 2 decimal places.