You are interested in getting the effect of X on Y. You think that you need to control for Z, and you also want to know whether the effect of X on Y differs across group D. What should you regress Y on? Don't add any predictors that aren't necessary. X, D, and the interaction between X and Z X, D, and Z OX, D, Z, and the interaction between X and D OX, D, Z, and the interaction between X and Z X, Z, and the interaction between X and D
You are interested in getting the effect of X on Y. You think that you need to control for Z, and you also want to know whether the effect of X on Y differs across group D. What should you regress Y on? Don't add any predictors that aren't necessary. X, D, and the interaction between X and Z X, D, and Z OX, D, Z, and the interaction between X and D OX, D, Z, and the interaction between X and Z X, Z, and the interaction between X and D

MATLAB: An Introduction with Applications
6th Edition
ISBN:9781119256830
Author:Amos Gilat
Publisher:Amos Gilat
Chapter1: Starting With Matlab
Section: Chapter Questions
Problem 1P

Related questions
Question
Please answer in 30 minute
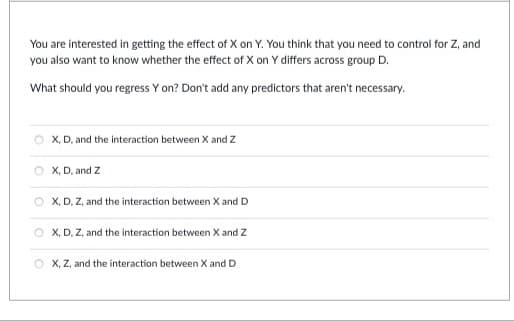
Transcribed Image Text:You are interested in getting the effect of X on Y. You think that you need to control for Z, and
you also want to know whether the effect of X on Y differs across group D.
What should you regress Y on? Don't add any predictors that aren't necessary.
X, D, and the interaction between X and Z
OX, D, and Z
OX, D, Z, and the interaction between X and D
OX, D, Z, and the interaction between X and Z
OX, Z, and the interaction between X and D
Expert Solution
This question has been solved!
Explore an expertly crafted, step-by-step solution for a thorough understanding of key concepts.

Step by step
Solved in 3 steps

Recommended textbooks for you
MATLAB: An Introduction with Applications
Statistics
ISBN:
9781119256830
Author:
Amos Gilat
Publisher:
John Wiley & Sons Inc

Probability and Statistics for Engineering and th…
Statistics
ISBN:
9781305251809
Author:
Jay L. Devore
Publisher:
Cengage Learning

Statistics for The Behavioral Sciences (MindTap C…
Statistics
ISBN:
9781305504912
Author:
Frederick J Gravetter, Larry B. Wallnau
Publisher:
Cengage Learning
MATLAB: An Introduction with Applications
Statistics
ISBN:
9781119256830
Author:
Amos Gilat
Publisher:
John Wiley & Sons Inc
Probability and Statistics for Engineering and th…
Statistics
ISBN:
9781305251809
Author:
Jay L. Devore
Publisher:
Cengage Learning
Statistics for The Behavioral Sciences (MindTap C…
Statistics
ISBN:
9781305504912
Author:
Frederick J Gravetter, Larry B. Wallnau
Publisher:
Cengage Learning

Elementary Statistics: Picturing the World (7th E…
Statistics
ISBN:
9780134683416
Author:
Ron Larson, Betsy Farber
Publisher:
PEARSON

The Basic Practice of Statistics
Statistics
ISBN:
9781319042578
Author:
David S. Moore, William I. Notz, Michael A. Fligner
Publisher:
W. H. Freeman

Introduction to the Practice of Statistics
Statistics
ISBN:
9781319013387
Author:
David S. Moore, George P. McCabe, Bruce A. Craig
Publisher:
W. H. Freeman