Shown below are the scatterplots and results of three linear regression analyses done that relate several different behavioural traits to one another in crabs, taken directly from a published paper. The dashed line in each is the line of best fit (least squares regression line). The fitted regression equation, r-value and p-value for each analysis are given in the figure legend below the graphs. Relationships among personality traits in the swimming crab Portunus trituberculatus. Each data point represents an individual crab; data are shown as the specific valye of personality traits (n=88). (A) Relationship between boldness and activity (y=36.04x-17.572, r=0.459, P=0.00). (B) Relationship between activity and hesitancy (y=-0.152x+3.37, r=0.305, P=0.00). (C) Relationship between boldness and hesitancy (y=-1.18x+7.07, r=0.158, P=0.02) For each graph (A – C) and the corresponding results in the figure caption above (A – C), comment on whether the result indicates the null hypothesis can be rejected (yes/no), and whether the analysis has met the assumptions of the analysis (yes/no); if an assumption is not met, note which one(s). Reject the null hypothesis for the slope? Are assumptions met? If not, which one(s)? Reject the null hypothesis for the slope? Assumptions met? If not, which one(s)? Reject the null hypothesis for the slope? Assumptions met? If not, which one(s)?


question 2
Shown below are the
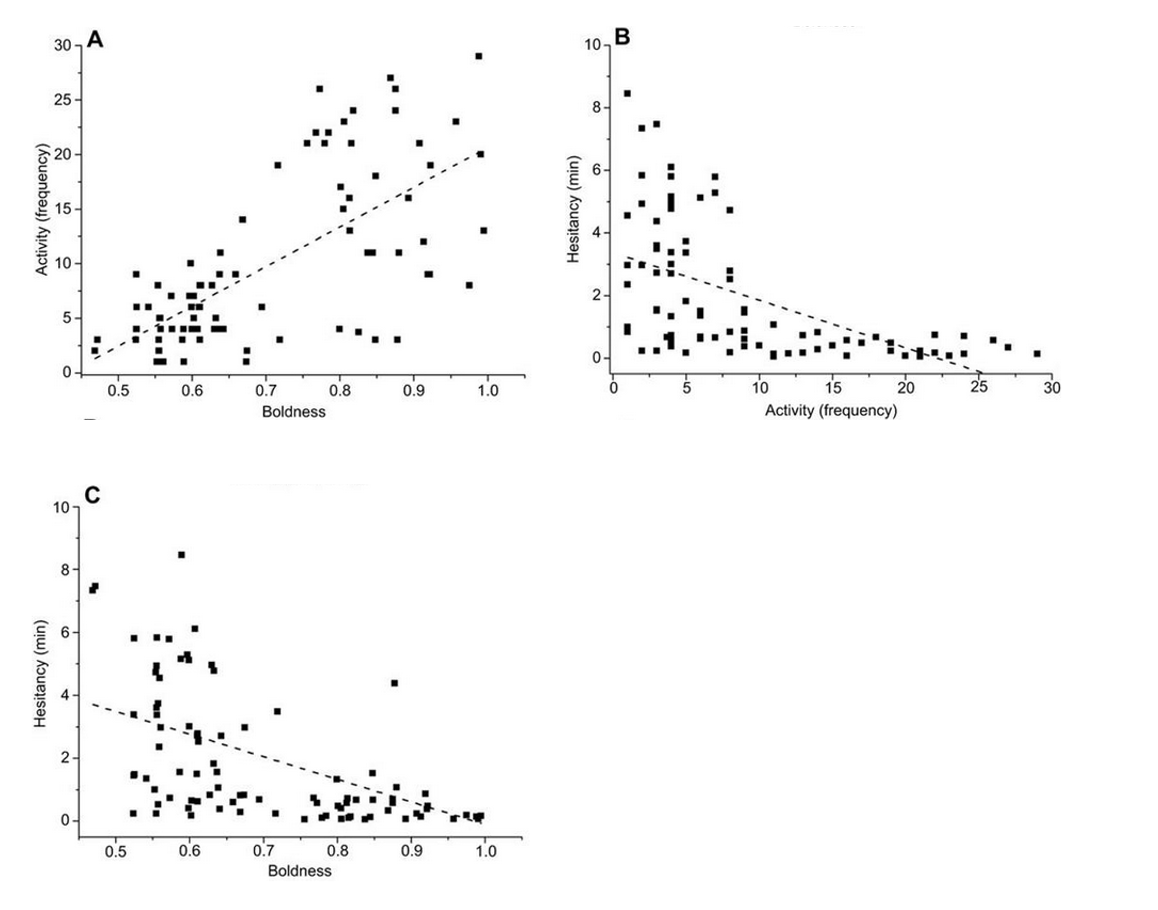
Relationships among personality traits in the swimming crab Portunus trituberculatus. Each data point represents an individual crab; data are shown as the specific valye of personality traits (n=88). (A) Relationship between boldness and activity (y=36.04x-17.572, r=0.459, P=0.00). (B) Relationship between activity and hesitancy (y=-0.152x+3.37, r=0.305, P=0.00). (C) Relationship between boldness and hesitancy (y=-1.18x+7.07, r=0.158, P=0.02)
For each graph (A – C) and the corresponding results in the figure caption above (A – C), comment on whether the result indicates the null hypothesis can be rejected (yes/no), and whether the analysis has met the assumptions of the analysis (yes/no); if an assumption is not met, note which one(s).
- Reject the null hypothesis for the slope?
Are assumptions met? If not, which one(s)?
- Reject the null hypothesis for the slope?
Assumptions met? If not, which one(s)?
- Reject the null hypothesis for the slope?
Assumptions met? If not, which one(s)?

Step by step
Solved in 3 steps with 2 images
