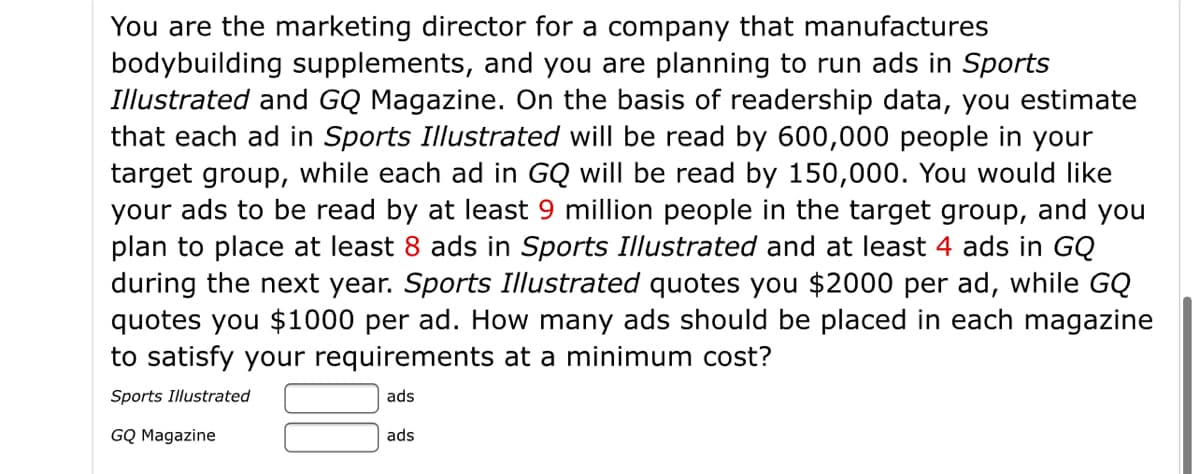
You are the marketing director for a company that manufactures bodybuilding supplements, and you are planning to run ads in Sports Illustrated and GQ Magazine. On the basis of readership data, you estimate that each ad in Sports Illustrated will be read by 600,000 people in your target group, while each ad in GQ will be read by 150,000. You would like your ads to be read by at least 9 million people in the target group, and you plan to place at least 8 ads in Sports Illustrated and at least 4 ads in GQ during the next year. Sports Illustrated quotes you $2000 per ad, while GQ quotes you $1000 per ad. How many ads should be placed in each magazine to satisfy your requirements at a minimum cost? Sports Illustrated ads GQ Magazine ads
You are the marketing director for a company that manufactures bodybuilding supplements, and you are planning to run ads in Sports Illustrated and GQ Magazine. On the basis of readership data, you estimate that each ad in Sports Illustrated will be read by 600,000 people in your target group, while each ad in GQ will be read by 150,000. You would like your ads to be read by at least 9 million people in the target group, and you plan to place at least 8 ads in Sports Illustrated and at least 4 ads in GQ during the next year. Sports Illustrated quotes you $2000 per ad, while GQ quotes you $1000 per ad. How many ads should be placed in each magazine to satisfy your requirements at a minimum cost? Sports Illustrated ads GQ Magazine ads

Glencoe Algebra 1, Student Edition, 9780079039897, 0079039898, 2018
18th Edition
ISBN:9780079039897
Author:Carter
Publisher:Carter
Chapter10: Statistics
Section10.6: Summarizing Categorical Data
Problem 27PPS

Related questions

Concept explainers
Contingency Table
A contingency table can be defined as the visual representation of the relationship between two or more categorical variables that can be evaluated and registered. It is a categorical version of the scatterplot, which is used to investigate the linear relationship between two variables. A contingency table is indeed a type of frequency distribution table that displays two variables at the same time.
Binomial Distribution
Binomial is an algebraic expression of the sum or the difference of two terms. Before knowing about binomial distribution, we must know about the binomial theorem.
Topic Video
Question
Transcribed Image Text:You are the marketing director for a company that manufactures
bodybuilding supplements, and you are planning to run ads in Sports
Illustrated and GQ Magazine. On the basis of readership data, you estimate
that each ad in Sports Illustrated will be read by 600,000 people in your
target group, while each ad in GQ will be read by 150,000. You would like
your ads to be read by at least 9 million people in the target group, and you
plan to place at least 8 ads in Sports Illustrated and at least 4 ads in GQ
during the next year. Sports Illustrated quotes you $2000 per ad, while GQ
quotes you $1000 per ad. How many ads should be placed in each magazine
to satisfy your requirements at a minimum cost?
Sports Illustrated
ads
GQ Magazine
ads
Expert Solution
This question has been solved!
Explore an expertly crafted, step-by-step solution for a thorough understanding of key concepts.

This is a popular solution!

Trending now
This is a popular solution!

Step by step
Solved in 2 steps with 2 images

Knowledge Booster


Learn more about
Need a deep-dive on the concept behind this application? Look no further. Learn more about this topic, advanced-math and related others by exploring similar questions and additional content below.Recommended textbooks for you
Glencoe Algebra 1, Student Edition, 9780079039897…
Algebra
ISBN:
9780079039897
Author:
Carter
Publisher:
McGraw Hill

Linear Algebra: A Modern Introduction
Algebra
ISBN:
9781285463247
Author:
David Poole
Publisher:
Cengage Learning
Glencoe Algebra 1, Student Edition, 9780079039897…
Algebra
ISBN:
9780079039897
Author:
Carter
Publisher:
McGraw Hill
Linear Algebra: A Modern Introduction
Algebra
ISBN:
9781285463247
Author:
David Poole
Publisher:
Cengage Learning