You decided to conduct Bonferroni post hoc analyses in MS Excel. Inspect the MS Excel output and answer these questions. a) Were these poc hoc analyses conducted assuming equal variances? b) What is the directionality for each comparison? c) What is the new alpha level that you need to use to determine significance?
You decided to conduct Bonferroni post hoc analyses in MS Excel. Inspect the MS Excel output and answer these questions. a) Were these poc hoc analyses conducted assuming equal variances? b) What is the directionality for each comparison? c) What is the new alpha level that you need to use to determine significance?

Glencoe Algebra 1, Student Edition, 9780079039897, 0079039898, 2018
18th Edition
ISBN:9780079039897
Author:Carter
Publisher:Carter
Chapter4: Equations Of Linear Functions
Section: Chapter Questions
Problem 8SGR

Related questions
Question
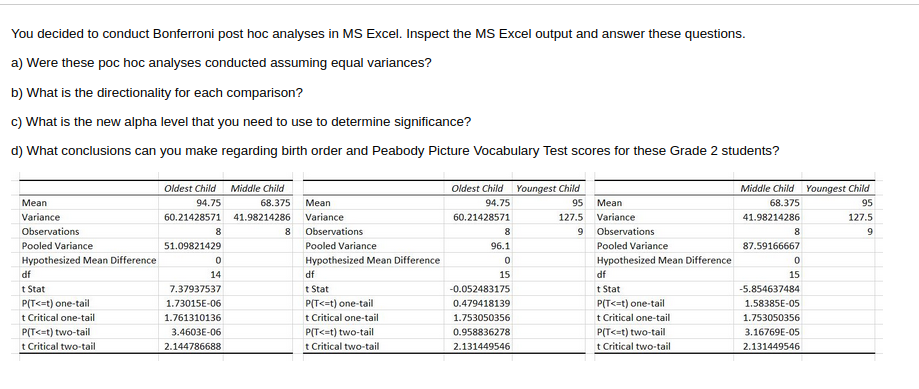
Transcribed Image Text:You decided to conduct Bonferroni post hoc analyses in MS Excel. Inspect the MS Excel output and answer these questions.
a) Were these poc học analyses conducted assuming equal variances?
b) What is the directionality for each comparison?
c) What is the new alpha level that you need to use to determine significance?
d) What conclusions can you make regarding birth order and Peabody Picture Vocabulary Test scores for these Grade 2 students?
Oldest Child Middle Child
Oldest Child Youngest Child
Middle Child Youngest Child
Mean
94.75
68.375
Mean
94.75
95 Mean
68.375
95
Variance
60.21428571 41.98214286
Variance
60.21428571
127.5
Variance
41.98214286
127.5
Observations
8.
Observations
8
Observations
8
Pooled Variance
51.09821429
Pooled Variance
96.1
Pooled Variance
87.59166667
Hypothesized Mean Difference
Hypothesized Mean Difference
Hypothesized Mean Difference
df
14
df
15
df
15
t Stat
P(T<=t) one-tail
t Critical one-tail
t Stat
P(T<=t) one-tail
7.37937537
t Stat
-0.052483175
-5.854637484
P(T<=t) one-tail
t Critical one-tail
1.73015E-06
0.479418139
1.58385E-05
1.761310136
1.753050356
t Critical one-tail
1.753050356
P(T<=t) two-tail
3.4603E-06
P(T<=t) two-tail
0.958836278
P(T<=t) two-tail
3.16769E-05
t Critical two-tail
2.144786688
t Critical two-tail
2.131449546
t Critical two-tail
2.131449546
Expert Solution
This question has been solved!
Explore an expertly crafted, step-by-step solution for a thorough understanding of key concepts.

Step by step
Solved in 2 steps

Recommended textbooks for you
Glencoe Algebra 1, Student Edition, 9780079039897…
Algebra
ISBN:
9780079039897
Author:
Carter
Publisher:
McGraw Hill
Glencoe Algebra 1, Student Edition, 9780079039897…
Algebra
ISBN:
9780079039897
Author:
Carter
Publisher:
McGraw Hill