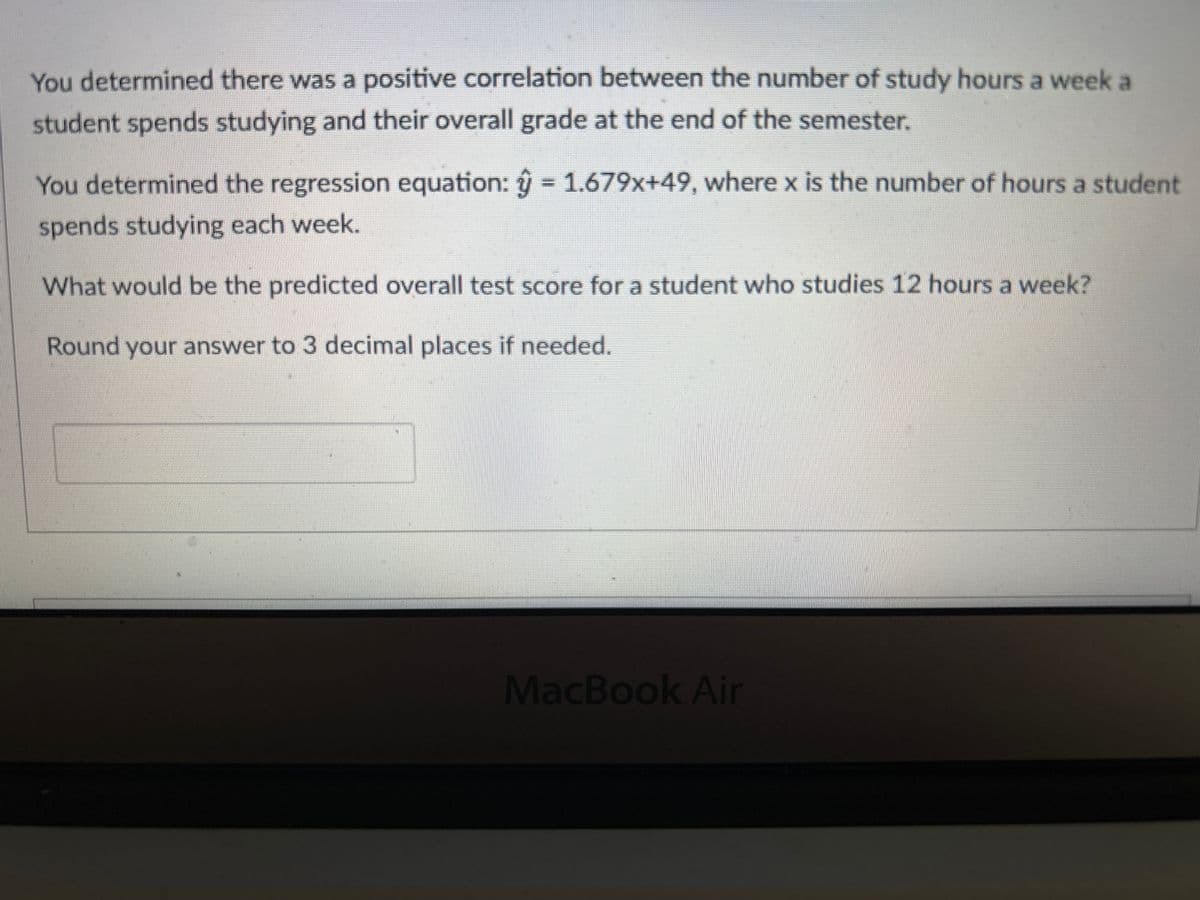
You determined there was a positive correlation between the number of study hours a week a student spends studying and their overall grade at the end of the semester. You determined the regression equation: ŷ = 1.679x+49, where x is the number of hours a student spends studying each week. What would be the predicted overall test score for a student who studies 12 hours a week? Round your answer to 3 decimal places if needed.


Q: Determine the sample mean for the following set of sample data. 19, 22, 25, 34 25 22 23.5 21
A: 19, 22, 25, 34 Sample size n =4 NOTE:- According to bartleby guidelines expert can solve only one…
Q: In the box shown below, each ticket should have two numbers: [ (1, ) , (1, 3) , (1, 3), (2, 5),…
A: Given the available pairs: [(1, ), (1, 3), (1, 3), (2, 5), (2, ___ ), (2, 3)] We need to fill in the…
Q: Fill in the blank. Given a collection of paired sample data, the Given a collection of paired sample…
A: For the given statement, we need to fill in the blank.
Q: The following data were collected from a Repeated-Measures study. Perform an ANOVA. Use…
A: Given that, GOTO EXCEL DATA---->DATA ANALYSIS DATA ANALYSIS---->One way ANOVA factor Give the…
Q: Tip: Population standard deviation: 0= 5. Find the range of dispersion and the population standard…
A: To find range and population standard deviation Sample size (n) = 6
Q: 3) The finished inside diameter of a Piston ring is normally distributed with a mean of 10…
A: The finished inside diameter of a piston ring is normally distributed with a mean of 10 centimeter…
Q: Looking at the table below what do you conclude in a test of weekly expenditure on fruit between…
A: Given hypothesis: Testing the null hypothesis of no difference against a 1-sided alternative that…
Q: Suppose that 4 cards are randomly chosen with replacement from a pack of 52 playing cards made up of…
A: In the game of chance, where four cards are randomly chosen with replacement from a deck of 52…
Q: 3. The weekly demand for propane gas (in 1000s of gallons) from a particular facility is a random…
A: “Since you have asked multiple questions, we will solve the first question for you. If you want any…
Q: An electrician wants to know whether batteries made by two manufacturers have significantly…
A: From the provided information, n1=50x1=130σ1=1n2=50x2=129σ2=4
Q: A. During the initial phase of a cross-sectional study, a survey was conducted to determine the…
A: Prevalence: Prevalence refers to the proportion or percentage of individuals in a population who…
Q: You wish to test the following claim (Ha) at a significance level of a = 0.001. Ho : μ = 67.3 Ha : μ…
A: Answer:- Given, Hypotheses are, H0 : μ=67.3 Ha : μ≠67.3 (Two-tailed test) Population standard…
Q: Assume that the data has a normal distribution and the number of observation is greater than fifty.…
A: Significance level (alpha) = 0.09 We know that, If x is random variable from standard normal…
Q: The number of births per woman in China is 1.6 down from 5.91 in 1966. This fertility rate has been…
A: Number of births Frequency 0 5 1 30…
Q: In a biology class, there are 40 students, 18 of whom are female and 22 are male. If two students…
A:
Q: Civil engineers often use the straight-line equation, y = bo+b 1x, to model the relationship between…
A: Hey there! Thank you for posting the question. Since there are multiple questions posted, we will…
Q: Question 5 "At a certain college, it is estimated that about 37% of the students have cars on…
A: About 37% of the students have cars on campus. Sample size n=48 Out of which x=24 students are found…
Q: A group of fairy-tale characters were surveyed about their pet preferences. The results of the…
A: The question is about frequency table Given : To find : Convert given table into relative freq.…
Q: By letting the GDP (gross domestic product) be the dependent variable (y), and the year (2002 -…
A: Given is a regression output for relationship b/w GDP and year for Germany and Ethiopia.
Q: what percent of values fall between 5.25 and 8.75 if the mean =5 and standard deviation =1.86
A: Answer: From the given data, Mean (μ) = 5 Standard deviation (σ) = 1.86 X follows normal…
Q: Use the given data to find the equation of the regression line. Examine the scatterplot and identify…
A: Given X = 5,10,8,7,6,4,11,12,9,13,3 Y =…
Q: How much of the variation in cost is not explained by production?
A: The Simple linear regression output is given. r=0.9751R2=0.9513n=30
Q: The following are the ratings of men by women in an experiment involving speed dating. Use the given…
A: The question is about 5 no. summary and graphical representation of the data Given : To find : 1…
Q: Calculate the measures of central tendency (mean, median, and mode) and the measures of dispersion…
A: To find the measures of central tendency and dispersion for the given data. Sample size (n) = 6
Q: How many data points are presented in the histogram? 5 4 3 2 1 0 0 1 2 3 4 5 6 7 8 9 10 11
A: The number of data points that are presented in the Histogram is determined below as follows: From…
Q: Alfa Beta Alfa 3/4 Beta NK ½
A: The provided transition matrix of bread sales of the brands Alpha and Beta is: T=Alpha…
Q: . Martin has hypothesized that the size and types of trees differ between valleys and higher…
A: the objective of Martin's study is to gather data and compare the characteristics of trees in a…
Q: A psychologist would like to examine the effects of different testing methods on the final…
A: The totals are T1=20,T2=12,T3=4 and G=36,∑X2=164.
Q: Confidence interval of the population mean is given by: X+2 x where X is the mean, s is the standard…
A: As per the given statement in the question, the confidence interval for the population mean is given…
Q: Please use literature and provide the pros and cons
A: The "Bp test" is not a standard statistical test or acronym commonly used in statistical analysis.…
Q: Historically, about 53% of the population of a certain country believed that the planet's…
A: claim : p ≠ 0.53n = 950x = 516α = 0.05
Q: The Service Corps of Retired Executives collected the data below to see if their small business…
A: given information type of contact face to face online telephone total before Katrina 729…
Q: Central topic Markov chains: People who work in the center of a growing city and do not live in the…
A:
Q: 2. Imagine that, instead of estimating y = XB+, you estimate y = Zy+ & where Z = XP with P being a…
A: It is estimated y=Zγ+ε where Z=XP with P being a non-singular matrix which transforms the columns of…
Q: Find the margin of error for the 95% confidence interval used to estimate the population proportion.…
A: Given that n= 2440p^=70%=0.7 The confidence level is 95% confidence level.Significance…
Q: iF Xn Bin (60 0.7) Find P(X=4)
A: X~Binomial(n=6 , p=0.7) then find P(X=4)=?
Q: 39/ iF X is a random Variable has poisson distribution with 2=4 Find P(X=3)
A: From the provided information, X is a random variable has Poisson distribution with λ = 4
Q: what percent of values fall between 5.25 and 8.75 if the mean =7 and standard deviation =1.75
A: Mean=7 Standard deviations=1.75
Q: 1- IF X~ N(25.36) then the value of such that PC/X-251 <C=0.9544 C quals to
A: Hi! Thank you for the question, As per the honor code, we are allowed to answer one question at a…
Q: The one-sample -statistic for a test of Ho: 4 = 42 versus H, : I < 42 based on n = 15 observations…
A: Null Hypothesis H0:μ=42 Alternative Hypothesis Ha:μ<42 Sample size n=15 The test statistic is…
Q: 2. What is the expected number of trials needed in order for all faces of a symmetric die to have…
A: Considering the die is symmetric, each face has an equal chance of appearance, i.e., Pi=16;…
Q: 1. GYThirteen cards are dealt on the table from a deck of standard playing cards. Compute the…
A: To compute the probabilities, we need to consider the total number of possible outcomes and the…
Q: A group of people were asked if some psychics can help solve murder cases. 220 responded "yes", and…
A: Answer:- Given, Number of respondents who said "yes", n(Yes) = 220 Number of respondents who said…
Q: A cell phone company offers two plans to its subscribers. At the time that subscribers sign the…
A: Plan 1 : Distribution has a positive skew N1 = 40 Median (M1) = 57000 Standard deviation (S1) =…
Q: In the multiple regression model, the adjusted R², Ŕ²: A. cannot decrease when an additional…
A: It is needed to discuss about the adjusted R2.
Q: Find the necessary confidence interval for the binomial proportion p. (Round your answers to three…
A: x = 191 n = 200
Q: Percentage variance and turkey HSD
A: For this problem, we need to use the ANOVA (Analysis of Variance) test to examine if there are any…
Q: n running a regression model with heteroscedastic errors, the estimators given by Weighted Least…
A: In running a regression model with heteroscedastic errors , the estimators given by weighed least…
Q: A bag contains 9 Blue balls, 10 Red balls, and 12 Green balls. Two balls are going to be drawn from…
A: Concept : Probability = favorable / total Blue = 9 Red = 10 Green = 12 Total = 12 + 10 + 9 =…
Q: Student Chris Mary Paul Juan Marcelo Table #1 1. SP 2.2 3. ΣΧ 4. 5. SSX 6. ΣΥ 7. SSY a 8. b Number…
A: There are 10 sub parts out of which I have solved 8 parts
Need help with #17

Step by step
Solved in 3 steps

- For the following exercises, consider the data in Table 5, which shows the percent of unemployed in a city of people 25 years or older who are college graduates is given below, by year. 38. Determine whether the trend appears to be linear.If so, and assuming the trend continues, find alinear regression model to predict the percent of unemployed in a given year to three decimal places.For the following exercises, consider the data in Table 5, which shows the percent of unemployed ina city of people 25 years or older who are college graduates is given below, by year. 40. Based on the set of data given in Table 6, calculate the regression line using a calculator or other technology tool, and determine the correlation coefficient to three decimal places.For the following exercises, consider this scenario: The profit of a company decreased steadily overa ten-year spam.The following ordered pairs shows dollars and the number of units sold in hundreds and the profit in thousands ofover the ten-year span, (number of units sold, profit) for specific recorded years: (46,600),(48,550),(50,505),(52,540),(54,495). Use linear regression to determine a function Pwhere the profit in thousands of dollars depends onthe number of units sold in hundreds.
- For the following exercises, consider the data in Table 5, which shows the percent of unemployed in a city ofpeople25 years or older who are college graduates is given below, by year. 41. Based on the set of data given in Table 7, calculatethe regression line using a calculator or othertechnology tool, and determine the correlationcoefficient to three decimal places.For the following exercises, refer to Table 8. Use the regression feature to find an exponential function that best fits the data in the table.For the following exercises, consider this scenario: The population of a city increased steadily over a ten-year span.The following ordered pairs show the population and the year over the ten-year span (population, year) for specific recorded years: (3,600,2000);(4,000,2001);(4,700,2003);(6,000,2006) 42. Use linear regression to determine a function y,where the year depends on the population, to threedecimal places of accuracy.
- Based on the data from 6 students, the regression equation relating number of hours of preparation (x) and test score (y) is y=67.3 + 1.07x . What is the best predicted test score for a student who spent 120 minutes preparing for the test?The researchers decide to use simple linear regression to obtain a regression equation that would allow them to predict how many meals would be eaten according to a preference for exotic foods. The following regression equation is obtained: Y = 2.185 + 0.523X How many meals would someone be predicted to eat if they obtain a score of 3.8 on food preference ?Sir Francis Galton, a cousin of James Darwin, examined the relationship between the height of children and their parents towards the end of the 19th century. It is from this study that the name “regression” originated. You decide to update his findings by collecting data from 110 college students, and estimate the following relationship: Studenth = 19.6 + 0.73×Midparh, SEE = 2.0 and R2 = 0.45, where Studenth is the height of students in inches, and Midparh is the average of the parental heights. (Following Galton’s methodology, both variables were adjusted so that the average female height was equal to the average male height.) a) Interpret the estimated slope coefficient. b) What is the prediction for the height of a child whose parents have an average height of 70.06 inches?
- A high school wants to predict her students score on a midterm exam y, given the number of hours a student spent studying x1 and the students average homework grade x2. She obtains the multiple regression equation y=-2.662+4.686x1+0.753x2. Predict the midterm exam score of a student with an average homework grade of 85, who spent 4 hours studying. Round to the nearest integer.A study of king penguins looked for a relationship between how deep the penguins dive in meters xx to seek food and how long they stay underwater in minutes yy. Based on sample data, the regression line is found to be y^=2.69+0.0116x Use the regression line to estimate how long a typical dive of 200 meters would last. Round your answer to two decimal points.For the regression equation, Y’ = – 2 + X, if the mean for Y is 6, what is the mean for X?