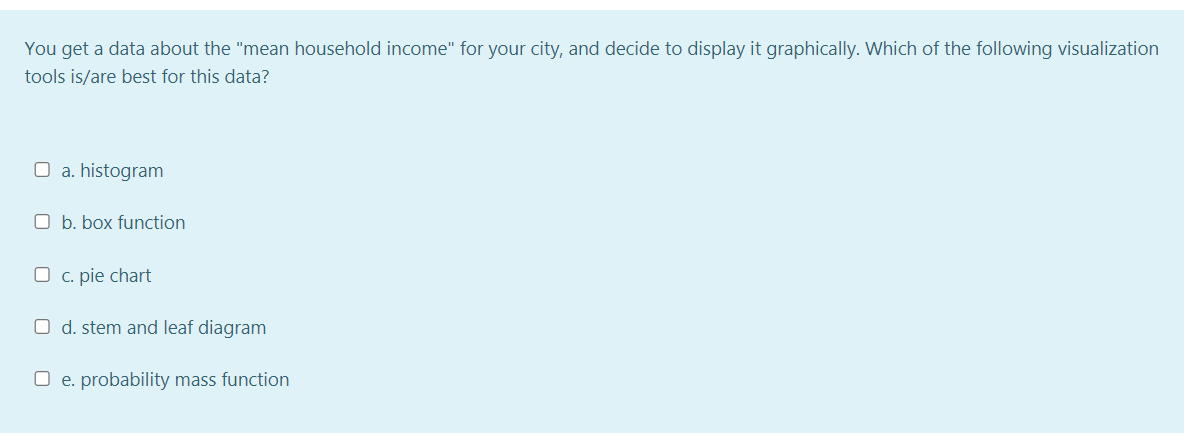
You get a data about the "mean household income" for your city, and decide to display it graphically. Which of the following visualization tools is/are best for this data? O a. histogram O b. box function O c. pie chart O d. stem and leaf diagram O e. probability mass function
You get a data about the "mean household income" for your city, and decide to display it graphically. Which of the following visualization tools is/are best for this data? O a. histogram O b. box function O c. pie chart O d. stem and leaf diagram O e. probability mass function

Glencoe Algebra 1, Student Edition, 9780079039897, 0079039898, 2018
18th Edition
ISBN:9780079039897
Author:Carter
Publisher:Carter
Chapter10: Statistics
Section10.6: Summarizing Categorical Data
Problem 4BGP

Related questions
Topic Video
Question
Transcribed Image Text:You get a data about the "mean household income" for your city, and decide to display it graphically. Which of the following visualization
tools is/are best for this data?
O a. histogram
O b. box function
O c. pie chart
O d. stem and leaf diagram
O e. probability mass function
Expert Solution
This question has been solved!
Explore an expertly crafted, step-by-step solution for a thorough understanding of key concepts.

Step by step
Solved in 2 steps

Knowledge Booster


Learn more about
Need a deep-dive on the concept behind this application? Look no further. Learn more about this topic, statistics and related others by exploring similar questions and additional content below.Recommended textbooks for you
Glencoe Algebra 1, Student Edition, 9780079039897…
Algebra
ISBN:
9780079039897
Author:
Carter
Publisher:
McGraw Hill
Glencoe Algebra 1, Student Edition, 9780079039897…
Algebra
ISBN:
9780079039897
Author:
Carter
Publisher:
McGraw Hill