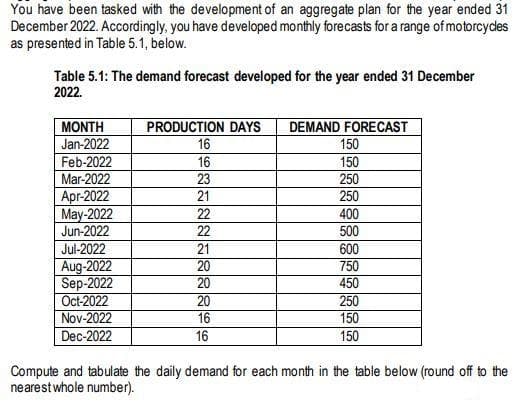
You have been tasked with the development of an aggregate plan for the year ended 31 December 2022. Accordingly, you have developed monthly forecasts for a range of motorcycles as presented in Table 5.1, below. Table 5.1: The demand forecast developed for the year ended 31 December 2022. MONTH Jan-2022 Feb-2022 Mar-2022 Apr-2022 May-2022 Jun-2022 Jul-2022 Aug-2022 Sep-2022 Oct-2022 Nov-2022 Dec-2022 PRODUCTION DAYS DEMAND FORECAST 16 16 23 21 22 22 21 20 20 20 16 16 150 150 250 250 400 500 600 750 450 250 150 150 Compute and tabulate the daily demand for each month in the table below (round off to the nearest whole number).


Q: Describe, with examples, why it is beneficial for operations managers to anticipate changes to…
A: Operations managers are tasked with managing the flow of products and services to customers. They…
Q: determine the in-transit inventory of the Mashburn Rail option if the Onion Shack purchases 240,000…
A: Annual purchase = 240000 Number of days in a year = 365 Average purchase per day = 240000/365 =…
Q: K The following table gives the map coordinates and the shipping loads for a set of cities that we…
A: The best method for calculating the location for central hub is center of gravity method. This…
Q: Step 1 of 4: Determine the three-period moving average for the next time period. If necessary, round…
A: Forecasting is a technique used to predict future outcomes on the basis of past data. In businesses…
Q: In 200 words or more, explain the importance of location strategy to an organization.
A: A location strategy is an approach for selecting the most suitable place for an organization by…
Q: UCLp = of a sample size of 500, the upper and lower (enter your response as a number between 0 and…
A: It is given that defect rate is 4.50 % or 0.045. So, p-bar = 0.045 Sample Size (n) = 500z = 3…
Q: Hart Manufacturing makes three products. Each product requires manufacturing operations in three…
A: As per the given instructions, the decision variables are as follows. P1 = Units of product 1…
Q: Manufacturing operations can be classified according to the amount of processing or assembly that…
A: Manufacturing operations can be explained as a set of activities that are involved in the production…
Q: What is the average lines per order for the set of multi-line orders?
A: Given: Average lines per order = 2.8 Single line order = 60%
Q: If the labor cost per day for Location A is $8,000 with a production of 40 units per day, and the…
A: "Since you have asked multiple questions, we will solve the first question for you. If you want any…
Q: Project management tools and techniques........................ Are used to select the…
A: Are used to select the appropriate and potential projects:- Project management tools and techniques…
Q: A manufacturing company produces single item product. The production manager decide to arrange 6…
A: Find the Given details below: Period 1 2 3 4 5 6 Forecast 112 157 126 176 124 181 Customer…
Q: a) What is the ROP to satisfy a %90 probability of not stocking out? b) What is the safety stock? c)…
A: Daily demand (d) = 100 Standard deviation demand (Sd) = 12 Lead time (L) = 5 Standard deviation (Sl)…
Q: Problem 9-1 (Static) [The following information applies to the questions displayed below.] The…
A: Check sheet is a real time data collection tool. This tool is used at the location where the…
Q: QUESTION 12 A restaurant chain is hyper concerned about products in its supply chain that could be…
A: SCM is a strategic approach to integrating supply and demand in the market. It involves several…
Q: The average daily demand and standard deviation of daily demand for a product is 800 and 12…
A: Daily demand = d = 800 units Standard deviation of daily demand = σ = 12 Replenishment lead time = L…
Q: Briefly explain this statement -" Importance of Quality control (QA) and Quality Assurance (QA) for…
A: Ans) Now a days quality of product or goods have increased rapidly. Also customer demand is greater…
Q: Operations Management CH 3 QUESTION 22 Tucson Machinery, Incorporated, manufactures numerically…
A: Given data:
Q: Company X is the leading producer of state-of-the-art printers. They have been developing a layout…
A: Organizations are daily getting indulged in their complex operations that bring about a big change…
Q: Skinner’s Fish Market buys fresh Boston bluefish daily for $4.20 per pound and sells it for $6 per…
A: Critical ratio is the rule that used to priority sequencing of waiting for processing at a work…
Q: 5- A sourcing strategy for procuring leverage items would be to? a-use reverse auctions.…
A: Ans) 5) Leverage items are the High profit impact with low supply risk. Not used for decentralized…
Q: Maximum Flow
A: To find out the number of vehicles that can move from school to park can be calculated using the…
Q: IN THE MID-1960S, WALT DISNEY’S DREAM was to build a family resort destination like no other. The…
A: Forecasting is a technique to predict future value. It is useful to predict future demand, sales, or…
Q: Count the number of responses at each level (1 through 10). If your answer is zero, enter "0". Round…
A: Rating Number Customer Number 1 1 38 2 3 9, 39, 47 3 2 37, 41 4 6 5, 10, 11, 16, 28, 35 5…
Q: what is the cause and effect diagram and discuss its benefits and application in the project…
A: A cause-effect is a graphic tool used to graphically depict potential explanations for a particular…
Q: Clinic administrator Dana Schniederjans wants you to forecast patient numbers at the clinic for week…
A: Forecasting is a technique used to predict future outcomes on the basis of past data. In businesses…
Q: What is organizational behavior
A: Ans) Organizational Behaviour is defined as the study of human behaviour in organization environment…
Q: The McGranger Mortgage Company is interested in monitoring the performance of the mortgage process.…
A: To measure the ability of a process that whether it is able to meet the specifications targets or…
Q: Other than being a critical component of operations, quality has implications for three other…
A: Quality is one of the factors that play role in two important areas of a business, customer…
Q: A boutique cafe in the city operates 365 days a year. The cafe has an annual demand for food…
A:
Q: Which of these changes will serve to break order synchronization? a. Have each customer order once a…
A: Which of these changes will serve to break order synchronization? a. Have each customer order once a…
Q: The ZU cafeteria serves on average 4000 customers a day during the lunch break (12:00-2:00pm). It…
A: Find the details below: The average number of Customers: 4000 Customers Lunch break Starts at 12:00…
Q: Discuss the purpose of employing business process modeling and notation in organizations, why it is…
A: By providing a data-driven visual presentation of the most important business processes, business…
Q: Why we should not hire a staff through friend's recommendation and should go through proper process…
A: Ans) Hiring a staff through friend's recommendation is not a good idea for the business. Business…
Q: 1. Explain the meaning of the term production or operations and describe the three kinds of utility…
A: As per guidelines, answering the 1st question. 1. Production/operations refers to the process in…
Q: A project is scheduled to complete in six months duration. There are two activities in the project.…
A: Actual cost of Activity 1 = AC1 = SAR 300,000 Actual cost of Activity 2 = AC2 = SAR 200,000 Planned…
Q: 9. You are given some additional time for Engine time that will increase the demand constraint from…
A: LPP is formulated as below. Let, The number of EZ-Rider produced is x1 The number of Lady-Sport…
Q: The following table shows the fixed cost and variable cost for 3 locations. Construct cost curves…
A: Total cost for any location = Fixed cost + Number of units X Variable cost per unit Compute the…
Q: What is the difference between process versus product layout? Where is each best?
A: Here, I would establish the difference between process layout and product layout with examples,…
Q: WEEK 1 maner 234567 ∞ 8 FORECAST DEMAND 135 135 135 134 134 144 155 156 Week 1 2 3 4 5 6 7 8 ACTUAL…
A: MAD is the proportion between total absolute error values and the number of weeks considered to…
Q: a quality control process find $45.6 defects for every 7,600 unit of production. what percent of the…
A: Number of defects found = 45.6 defects Total units of production = 7600 units We have to find the…
Q: A renovation of the gift shop at Orlando Amway Center has six activities hours). In the following…
A: The optimistic time (a), most likely time (m), and pessimistic time (b) are given for each activity…
Q: A company is planning on launching a new product. It was thinking of launching in June of next year,…
A: Find the Given details below: Given details: High Medium Low Beats the rival 0.6 0.25 0.15…
Q: The A&M Hobby Shop carries a line of radio-controlled model racing cars. Demand for the cars is…
A: Given data: Monthly demand (d) = 50 cars Then Annual demand (D) = 50 × 12 = 600 cars Ordering cost…
Q: Where did you get service rate from?
A: Service rate is the amount of customers served per unit time in any system
Q: RaceOne Motors is a car components components manufacturer. It can produce at a rate of 300 per day,…
A: Given data: Annual Demand = 12,500 Working days = 250 / year. The firm can produce at a rate (p) =…
Q: Operations Management CH 3 Question 14 Harlen Industries has a simple forecasting model: Take the…
A: Given data is
Q: Brenda opened a pool and spa store in a lively shopping mall and finds business to be booming but…
A: Given data:Demand = 10 boxes per weekStore open (n) = 48 weeks/yearOrder cost = $40/orderLead time =…
Q: Given the situation above with an output rate of five units per hour, a) Draw the network precedence…
A: Project schedule helps in calculating different values all related to the production cycle like the…
Q: K- The following table gives the number of pints of type A blood used at Damascus Hospital in the…
A: Given data is

Step by step
Solved in 2 steps with 2 images

- Scenario 3 Ben Gibson, the purchasing manager at Coastal Products, was reviewing purchasing expenditures for packaging materials with Jeff Joyner. Ben was particularly disturbed about the amount spent on corrugated boxes purchased from Southeastern Corrugated. Ben said, I dont like the salesman from that company. He comes around here acting like he owns the place. He loves to tell us about his fancy car, house, and vacations. It seems to me he must be making too much money off of us! Jeff responded that he heard Southeastern Corrugated was going to ask for a price increase to cover the rising costs of raw material paper stock. Jeff further stated that Southeastern would probably ask for more than what was justified simply from rising paper stock costs. After the meeting, Ben decided he had heard enough. After all, he prided himself on being a results-oriented manager. There was no way he was going to allow that salesman to keep taking advantage of Coastal Products. Ben called Jeff and told him it was time to rebid the corrugated contract before Southeastern came in with a price increase request. Who did Jeff know that might be interested in the business? Jeff replied he had several companies in mind to include in the bidding process. These companies would surely come in at a lower price, partly because they used lower-grade boxes that would probably work well enough in Coastal Products process. Jeff also explained that these suppliers were not serious contenders for the business. Their purpose was to create competition with the bids. Ben told Jeff to make sure that Southeastern was well aware that these new suppliers were bidding on the contract. He also said to make sure the suppliers knew that price was going to be the determining factor in this quote, because he considered corrugated boxes to be a standard industry item. Is Ben Gibson acting legally? Is he acting ethically? Why or why not?Scenario 3 Ben Gibson, the purchasing manager at Coastal Products, was reviewing purchasing expenditures for packaging materials with Jeff Joyner. Ben was particularly disturbed about the amount spent on corrugated boxes purchased from Southeastern Corrugated. Ben said, I dont like the salesman from that company. He comes around here acting like he owns the place. He loves to tell us about his fancy car, house, and vacations. It seems to me he must be making too much money off of us! Jeff responded that he heard Southeastern Corrugated was going to ask for a price increase to cover the rising costs of raw material paper stock. Jeff further stated that Southeastern would probably ask for more than what was justified simply from rising paper stock costs. After the meeting, Ben decided he had heard enough. After all, he prided himself on being a results-oriented manager. There was no way he was going to allow that salesman to keep taking advantage of Coastal Products. Ben called Jeff and told him it was time to rebid the corrugated contract before Southeastern came in with a price increase request. Who did Jeff know that might be interested in the business? Jeff replied he had several companies in mind to include in the bidding process. These companies would surely come in at a lower price, partly because they used lower-grade boxes that would probably work well enough in Coastal Products process. Jeff also explained that these suppliers were not serious contenders for the business. Their purpose was to create competition with the bids. Ben told Jeff to make sure that Southeastern was well aware that these new suppliers were bidding on the contract. He also said to make sure the suppliers knew that price was going to be the determining factor in this quote, because he considered corrugated boxes to be a standard industry item. As the Marketing Manager for Southeastern Corrugated, what would you do upon receiving the request for quotation from Coastal Products?Given the following forecast and cost information, Regular time cost $ 40.00 per unitdetermine the total cost of a plan that uses regular time Overtime cost $ 60.00 per unitproduction output of 600 units per month, overtime is subcontracting cost $ 80.00 per unitused when needed up to a maximum of 60 units per holding cost $ 10.00 per unit per monthmonth, and subcontracting is used if additional units are needed to meet the forecast.Month Forecast1 5702 6003 6304 6505 6706 690Totals
- a. What is your forecast for December of Year 4, making period 1 as the starting period for the regression? b. The actual demand for period 48 was just learned to be 5,100. Add this demand to the Inputs file and change the starting period for the regression to period 2 so that the number of periods in the regression remains unchanged. How much or little does the forecast for period 49 change from the one for period 48? The error measures? Are you surprised?c. Now change the time when the regression starts to period 25 and repeat the process. What differences do you note now? What forecast will you make for period 49?1. Using MAD as the criterion, which of the following models would you use for thegiven time series data? Why?A. Naïve approach;B. 5-month SMA model;C. WMA model with weights 0.1, 0.3, and 0.6; orD. ES model with α = 0.5 and a forecast of 3,500 liters in the first month.NOTE: In answering Item 1, mention the whole description of the model; i.e., not just“SMA model”, but “SMA model with n = ...”; not just “WMA model”, but “WMA modelwith weights ...”; not just “ES model”, but “ES model with α = ...”.a) The demand forecast for Month 6 would be: A. 565 haircuts B. 574 haircuts C. 578 haircuts D. 584 haircuts b) With Mean Absolute Deviation (MAD) as the criterion, the best forecasting model for this time series data is: A. Naïve approach B. 2-week Simple Moving Average (SMA) C. Weighted Moving Average (WMA) with weights: 0.5, 0.3, 0.2 D. Exponential Smoothing (ES) with alpha = 0.8
- Product A is an assemble-to-order product. It has a lot size of 150, and currentlyhas an on-hand inventory of 110 units. There is a 2-week demand time fence and a12-week planning time fence. The following table gives the original forecast and theactual customer orders for the next 12 weeks:Week 1 2 3 4 5 6 7 8 9 10 11 12Forecast 80 80 80 70 70 70 70 70 70 70 70 70Demand 83 78 65 61 49 51 34 17 11 7 0 0a. Given this information, develop a realistic master schedule, complete with ATPlogic.b. Tell how you would respond to each of the following customer order requests.Assume these are independent requests, and do not have cumulative effects.■ 20 units in week 3■ 40 units in week 5■ 120 units in week 7There is an ongoing debate about the roles of quantitative and qualitative inputs in demand estimation and forecasting. Those in the qualitative camp argue that statistical analysis can only go so far. Demand estimates can be further improved by incorporating purely qualitative factors. Quantitative advocates insist that qualitative, intuitive, holistic approaches only serve to introduce errors, biases, and extraneous factors into the estimation task. Suppose the executive for the theater chain is convinced that any number of bits of qualitative information (the identity of the director, the film’s terrific script and rock-music sound track, the Hollywood “buzz” about the film during production, even the easing of his ulcer) influence the film’s ultimate box-office revenue. How might one test which approach—purely qualitative or statistical, provides better demand or revenue estimates? Are there ways to combine the two approaches? Provide concrete suggestionsThe following table represents sales data for milk (in hundred liters) sold by a grocery.Do the computations to fill out the table and answer the following questions:1. Using MAD as the criterion, which of the following models would you use for thegiven time series data? Why?A. Naïve approach;B. 5-month SMA model;C. WMA model with weights 0.1, 0.3, and 0.6; orD. ES model with α = 0.5 and a forecast of 3,500 liters in the first month.NOTE: In answering Item 1, mention the whole description of the model; i.e., not just“SMA model”, but “SMA model with n = ...”; not just “WMA model”, but “WMA modelwith weights ...”; not just “ES model”, but “ES model with α = ...”.2. Interpret the MAD of the most accurate among the forecasting models above.3. Based on your decision in Item 1, what should be the forecast for Month 11?
- The following table shows the actual demand observed over the last 11 years: Year 1 2 3 4 5 6 7 8 9 10 11 Demand 6 8 4 7 11 7 13 12 10 13 8 This exercise contains only parts b, c, and d. Part 2 b) Using the 3-year moving average, provide the forecast from periods 4 through 12 (round your responses to one decimal place). Part 3 c) Using the 3-year weighted moving average with weights 0.10, 0.30, and 0.60, using 0.60 for the most recent period, provide the forecast from periods 4 through 12 (round your responses to two decimal places). Part 4 d) Mean absolute deviation for the forecast developed…Table 5.1: The demand forecast developed for the year ended 31 December 2022. Month Production days Demand forecast Jan 16 150 Feb 16 150 Mar 23 250 Apr 21 250 May 22 400 Jun 22 500 Jul 21 600 Aug 20 750 Sep 20 450 Oct 20 250 Nov 16 150 Dec 16 150 1. Compute and tabulate the daily demand for each month in the table below (round off to the nearest whole number). 2. Assuming that MPQ Limited had adopted a level strategy for the year ended 31 December 2022, compute the average daily demand for the year (round off to the nearest whole number).In a manufacturing company, a product “A” is manufactured from components “B” and “C”. Also, the component “B” is manufactured from parts “D” and “E”. Which items should be forecasted?
