You have run two regressions of ADIDAS "AD" returns. In the first, you regressed ADIDAS monthly returns against returns on the DAX – both in DM terms: Ret "AD" = 0.04% + 1.7 (Returns dax ) R2 = 58% %3D You also regressed the returns on ADIDAS against the Morgan Stanley Capital Index "ms"that includes global equities – both returns are dollar returns: Ret "ad" = -0.02% + 0.9 (Returns "ms") R2 = 14% Assume that the seven of the top ten investors in ADIDAS are international mutual funds. (The German long term bond rate is 0.05 , the US long term bond rate is 0.062 and the equity risk premium in both markets is 6% Estimate ADIDAS cost of equity in DM terms
You have run two regressions of ADIDAS "AD" returns. In the first, you regressed ADIDAS monthly returns against returns on the DAX – both in DM terms: Ret "AD" = 0.04% + 1.7 (Returns dax ) R2 = 58% %3D You also regressed the returns on ADIDAS against the Morgan Stanley Capital Index "ms"that includes global equities – both returns are dollar returns: Ret "ad" = -0.02% + 0.9 (Returns "ms") R2 = 14% Assume that the seven of the top ten investors in ADIDAS are international mutual funds. (The German long term bond rate is 0.05 , the US long term bond rate is 0.062 and the equity risk premium in both markets is 6% Estimate ADIDAS cost of equity in DM terms

Chapter13: Direct Foreign Investment
Section: Chapter Questions
Problem 1IEE

Related questions
Question
i need the answer quickly
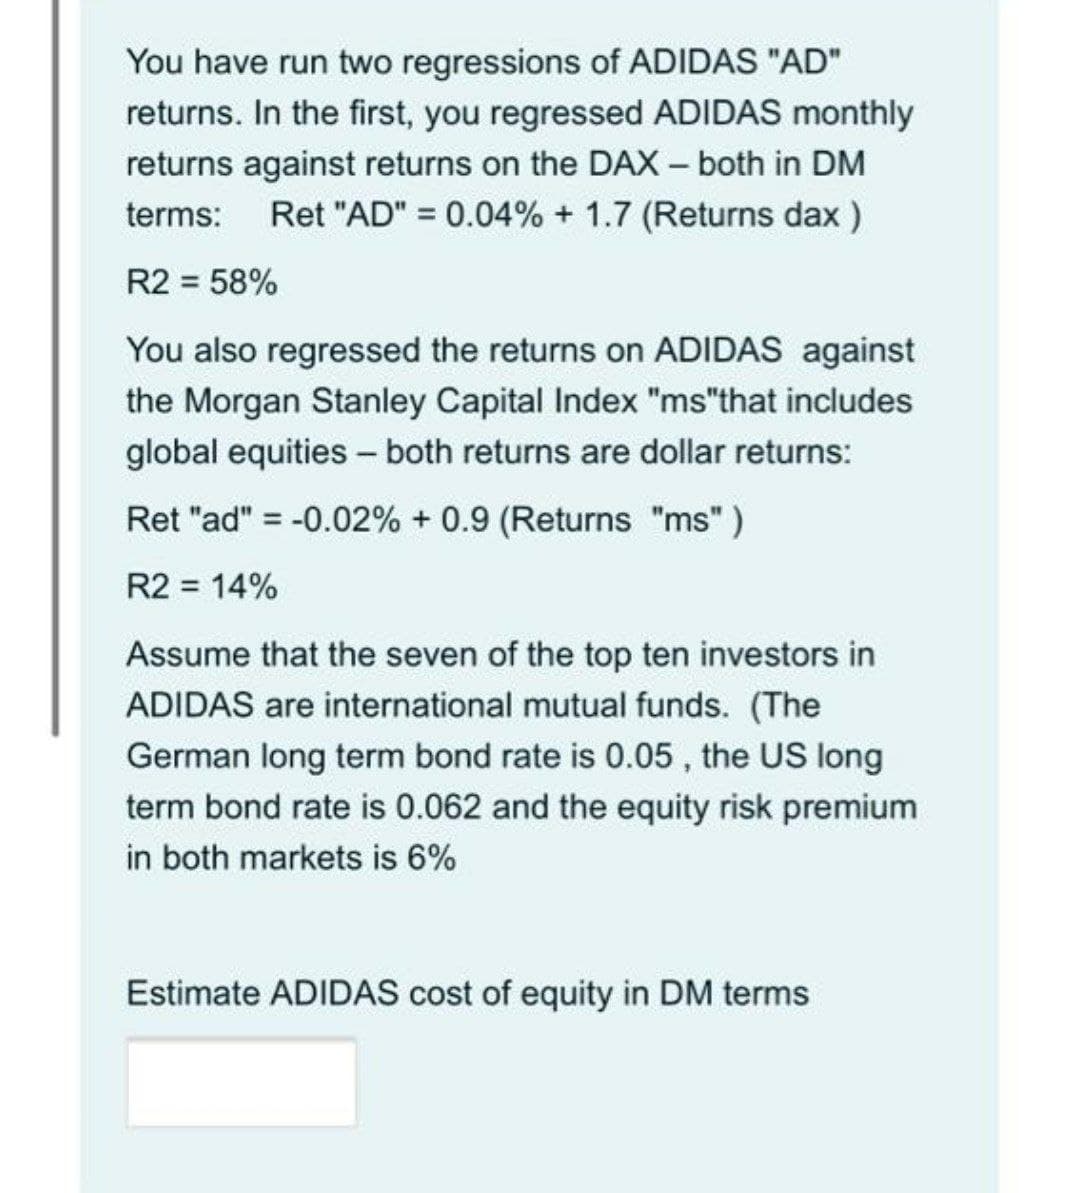
Transcribed Image Text:You have run two regressions of ADIDAS "AD"
returns. In the first, you regressed ADIDAS monthly
returns against returns on the DAX – both in DM
terms: Ret "AD" = 0.04% + 1.7 (Returns dax )
R2 = 58%
You also regressed the returns on ADIDAS against
the Morgan Stanley Capital Index "ms"that includes
global equities - both returns are dollar returns:
Ret "ad" = -0.02% + 0.9 (Returns "ms" )
R2 = 14%
Assume that the seven of the top ten investors in
ADIDAS are international mutual funds. (The
German long term bond rate is 0.05 , the US long
term bond rate is 0.062 and the equity risk premium
in both markets is 6%
Estimate ADIDAS cost of equity in DM terms
Expert Solution
This question has been solved!
Explore an expertly crafted, step-by-step solution for a thorough understanding of key concepts.

This is a popular solution!

Trending now
This is a popular solution!

Step by step
Solved in 3 steps

Knowledge Booster


Learn more about
Need a deep-dive on the concept behind this application? Look no further. Learn more about this topic, finance and related others by exploring similar questions and additional content below.Recommended textbooks for you