Returns earned over a given time period are called realized returns. Historical data on realized returns is often used to estimate future results. Analysts across companies use realized stock returns to estimate the risk of a stock. Five years of realized returns for Blue Llama Mining Inc. (Blue Llama) are given in the following table: 2016 2017 2018 2019 2020 Stock return 20.00% 13.60% 24.00% 33.60% 10.40% LAlso note that: 1. While Blue Llama was started 40 years ago, its common stock has been publicly traded for the past 25 years. 2. The returns on Blue Llama's equity are calculated as arithmetic returns. Given this return data, the average realized return on Blue Llama Mining Inc.'s stock is The preceding data series represents a sample of Blue Llama's historical returns. Based on this conclusion, the standard deviation of Blue Llama's historical returns is If investors expect the average realized return on Blue Llama Mining Inc.'s stock from 2016 to 2020 to continue into the future, its expected coefficient of variation (CV) is expected to equal
Returns earned over a given time period are called realized returns. Historical data on realized returns is often used to estimate future results. Analysts across companies use realized stock returns to estimate the risk of a stock. Five years of realized returns for Blue Llama Mining Inc. (Blue Llama) are given in the following table: 2016 2017 2018 2019 2020 Stock return 20.00% 13.60% 24.00% 33.60% 10.40% LAlso note that: 1. While Blue Llama was started 40 years ago, its common stock has been publicly traded for the past 25 years. 2. The returns on Blue Llama's equity are calculated as arithmetic returns. Given this return data, the average realized return on Blue Llama Mining Inc.'s stock is The preceding data series represents a sample of Blue Llama's historical returns. Based on this conclusion, the standard deviation of Blue Llama's historical returns is If investors expect the average realized return on Blue Llama Mining Inc.'s stock from 2016 to 2020 to continue into the future, its expected coefficient of variation (CV) is expected to equal

Essentials Of Business Analytics
1st Edition
ISBN:9781285187273
Author:Camm, Jeff.
Publisher:Camm, Jeff.
Chapter11: Monte Carlo Simulation
Section: Chapter Questions
Problem 9P

Related questions
Question
1.) Given this return data, the average realized return on Blue Llama Mining Inc.’s stock is _______ .
2.) The preceding data series represents a sample of Blue Llama’s historical returns. Based on this conclusion, the standard deviation of Blue Llama’s historical returns is _______ .
3.)
If investors expect the average realized return on Blue Llama Mining Inc.’s stock from 2016 to 2020 to continue into the future, its expected coefficient of variation (CV) is expected to equal _______ .
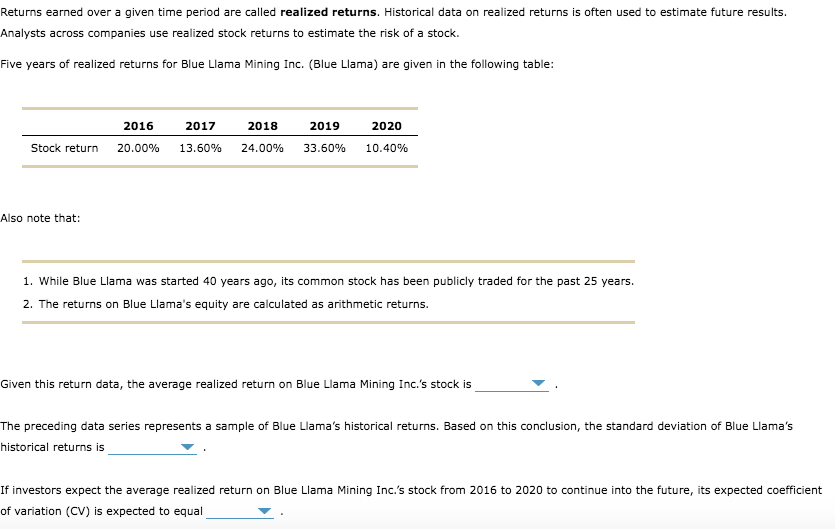
Transcribed Image Text:Returns earned over a given time period are called realized returns. Historical data on realized returns is often used to estimate future results.
Analysts across companies use realized stock returns to estimate the risk of a stock.
Five years of realized returns for Blue Llama Mining Inc. (Blue Llama) are given in the following table:
2016
2017
2018
2019
2020
Stock return
20.00%
13.60%
24.00%
33.60%
10.40%
Also note that:
1. While Blue Llama was started 40 years ago, its common stock has been publicly traded for the past 25 years.
2. The returns on Blue Llama's equity are calculated as arithmetic returns.
Given this return data, the average realized return on Blue Llama Mining Inc.'s stock is
The preceding data series represents a sample of Blue Llama's historical returns. Based on this conclusion, the standard deviation of Blue Llama's
historical returns is
If investors expect the average realized return on Blue Llama Mining Inc.'s stock from 2016 to 2020 to continue into the future, its expected coefficient
of variation (CV) is expected to equal
Expert Solution
This question has been solved!
Explore an expertly crafted, step-by-step solution for a thorough understanding of key concepts.

This is a popular solution!

Trending now
This is a popular solution!

Step by step
Solved in 2 steps with 2 images

Knowledge Booster


Learn more about
Need a deep-dive on the concept behind this application? Look no further. Learn more about this topic, finance and related others by exploring similar questions and additional content below.Recommended textbooks for you
Essentials Of Business Analytics
Statistics
ISBN:
9781285187273
Author:
Camm, Jeff.
Publisher:
Cengage Learning,


Fundamentals of Financial Management (MindTap Cou…
Finance
ISBN:
9781285867977
Author:
Eugene F. Brigham, Joel F. Houston
Publisher:
Cengage Learning
Essentials Of Business Analytics
Statistics
ISBN:
9781285187273
Author:
Camm, Jeff.
Publisher:
Cengage Learning,
Fundamentals of Financial Management (MindTap Cou…
Finance
ISBN:
9781285867977
Author:
Eugene F. Brigham, Joel F. Houston
Publisher:
Cengage Learning

Fundamentals of Financial Management, Concise Edi…
Finance
ISBN:
9781285065137
Author:
Eugene F. Brigham, Joel F. Houston
Publisher:
Cengage Learning

Fundamentals of Financial Management, Concise Edi…
Finance
ISBN:
9781305635937
Author:
Eugene F. Brigham, Joel F. Houston
Publisher:
Cengage Learning

Fundamentals of Financial Management (MindTap Cou…
Finance
ISBN:
9781337395250
Author:
Eugene F. Brigham, Joel F. Houston
Publisher:
Cengage Learning