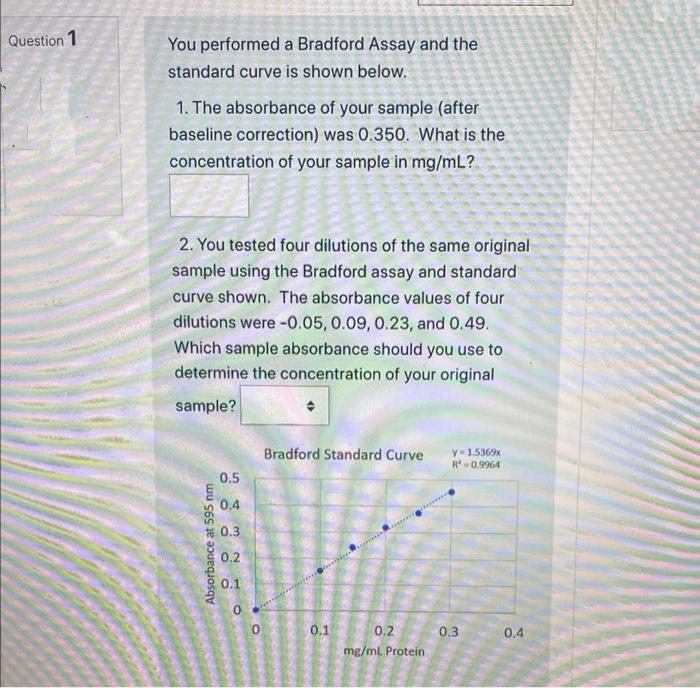
You performed a Bradford Assay and the standard curve is shown below. 1. The absorbance of your sample (after baseline correction) was 0.350. What is the concentration of your sample in mg/mL? 2. You tested four dilutions of the same original sample using the Bradford assay and standard curve shown. The absorbance values of four dilutions were -0.05, 0.09, 0.23, and 0.49. Which sample absorbance should you use to determine the concentration of your original sample? Absorbance at 595 nm 0.5 0.4 0.3 0.2 0.1 0 0 Bradford Standard Curve april 0.1 0.2 mg/ml Protein y=1.5369x R=0.9964 0.3 0.4
You performed a Bradford Assay and the standard curve is shown below. 1. The absorbance of your sample (after baseline correction) was 0.350. What is the concentration of your sample in mg/mL? 2. You tested four dilutions of the same original sample using the Bradford assay and standard curve shown. The absorbance values of four dilutions were -0.05, 0.09, 0.23, and 0.49. Which sample absorbance should you use to determine the concentration of your original sample? Absorbance at 595 nm 0.5 0.4 0.3 0.2 0.1 0 0 Bradford Standard Curve april 0.1 0.2 mg/ml Protein y=1.5369x R=0.9964 0.3 0.4

Chapter3: Statistical Tests With Excel
Section: Chapter Questions
Problem 9P

Related questions

Question
Transcribed Image Text:Question 1
You performed a Bradford Assay and the
standard curve is shown below.
1. The absorbance of your sample (after
baseline correction) was 0.350. What is the
concentration of your sample in mg/mL?
2. You tested four dilutions of the same original
sample using the Bradford assay and standard
curve shown. The absorbance values of four
dilutions were -0.05, 0.09, 0.23, and 0.49.
Which sample absorbance should you use to
determine the concentration of your original
sample?
Absorbance at 595 nm
0.5
0.4
0.3
0.2
0.1
0
0
Bradford Standard Curve
www
0.1
0.2
mg/ml. Protein
y 1.5369x
R 0.99641
0.3
0.4
Expert Solution
This question has been solved!
Explore an expertly crafted, step-by-step solution for a thorough understanding of key concepts.

Step by step
Solved in 2 steps

Knowledge Booster


Learn more about
Need a deep-dive on the concept behind this application? Look no further. Learn more about this topic, chemistry and related others by exploring similar questions and additional content below.Recommended textbooks for you