You run a regression analysis on a bivariate set of data (n = 86). With = 21.2 and Ⓒ = 24.3, you obtain the regression equation y = 4.105x62.726 with a correlation coefficient of r = 0.181. You want to predict what value (on average) for the response variable will be obtained from a value of x = 80 as the explanatory variable. What is the predicted response value? y =
You run a regression analysis on a bivariate set of data (n = 86). With = 21.2 and Ⓒ = 24.3, you obtain the regression equation y = 4.105x62.726 with a correlation coefficient of r = 0.181. You want to predict what value (on average) for the response variable will be obtained from a value of x = 80 as the explanatory variable. What is the predicted response value? y =

Glencoe Algebra 1, Student Edition, 9780079039897, 0079039898, 2018
18th Edition
ISBN:9780079039897
Author:Carter
Publisher:Carter
Chapter10: Statistics
Section10.1: Measures Of Center
Problem 9PPS

Related questions
Question
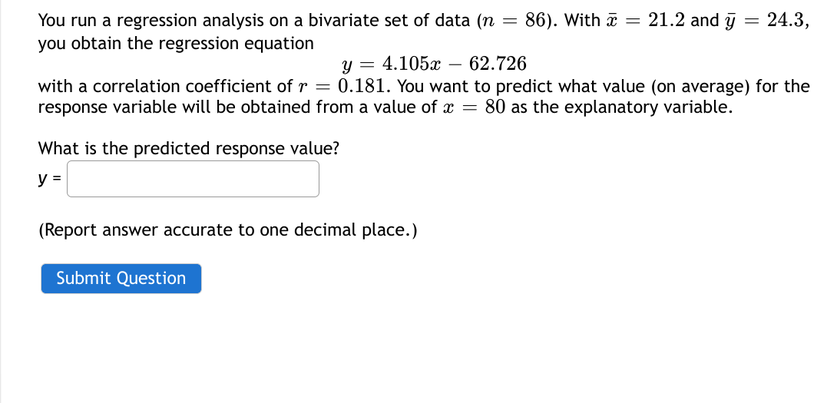
Transcribed Image Text:You run a regression analysis on a bivariate set of data (n = 86). With x = 21.2 and y = 24.3,
you obtain the regression equation
y = 4.105x62.726
with a correlation coefficient of r = 0.181. You want to predict what value (on average) for the
response variable will be obtained from a value of x = 80 as the explanatory variable.
What is the predicted response value?
y =
(Report answer accurate to one decimal place.)
Submit Question
Expert Solution
This question has been solved!
Explore an expertly crafted, step-by-step solution for a thorough understanding of key concepts.

Step by step
Solved in 2 steps

Recommended textbooks for you
Glencoe Algebra 1, Student Edition, 9780079039897…
Algebra
ISBN:
9780079039897
Author:
Carter
Publisher:
McGraw Hill
Glencoe Algebra 1, Student Edition, 9780079039897…
Algebra
ISBN:
9780079039897
Author:
Carter
Publisher:
McGraw Hill