You want to examine the effect of social media exposure (in hours) to people's mental health. Mental health is scored on a scale of 0 to 100, with 100 being best subjective mental health condition. You collect data from a random sample of college aged students and create two random variables: SocialMedia - hours of social media exposure per day MentalHealth - scale of 0 to 100, with 100 being best mental condition. sample mean SocialMedia- 15.38 sample mean MentalHealth- 90 sample variance SocialMedia- 792 sample variance MentalHealth= 2,363 correlation coefficient = -0.6 Use the sample descriptive statistics shown above and the OLS method to estimate the slope coefficient in the following linear regression model: Mental Health, = B + Pi Social Media, + u, Round your answer to two decimals.
You want to examine the effect of social media exposure (in hours) to people's mental health. Mental health is scored on a scale of 0 to 100, with 100 being best subjective mental health condition. You collect data from a random sample of college aged students and create two random variables: SocialMedia - hours of social media exposure per day MentalHealth - scale of 0 to 100, with 100 being best mental condition. sample mean SocialMedia- 15.38 sample mean MentalHealth- 90 sample variance SocialMedia- 792 sample variance MentalHealth= 2,363 correlation coefficient = -0.6 Use the sample descriptive statistics shown above and the OLS method to estimate the slope coefficient in the following linear regression model: Mental Health, = B + Pi Social Media, + u, Round your answer to two decimals.

College Algebra (MindTap Course List)
12th Edition
ISBN:9781305652231
Author:R. David Gustafson, Jeff Hughes
Publisher:R. David Gustafson, Jeff Hughes
Chapter8: Sequences, Series, And Probability
Section8.7: Probability
Problem 58E: What is meant by the sample space of an experiment?

Related questions

Concept explainers
Contingency Table
A contingency table can be defined as the visual representation of the relationship between two or more categorical variables that can be evaluated and registered. It is a categorical version of the scatterplot, which is used to investigate the linear relationship between two variables. A contingency table is indeed a type of frequency distribution table that displays two variables at the same time.
Binomial Distribution
Binomial is an algebraic expression of the sum or the difference of two terms. Before knowing about binomial distribution, we must know about the binomial theorem.
Topic Video
Question
5
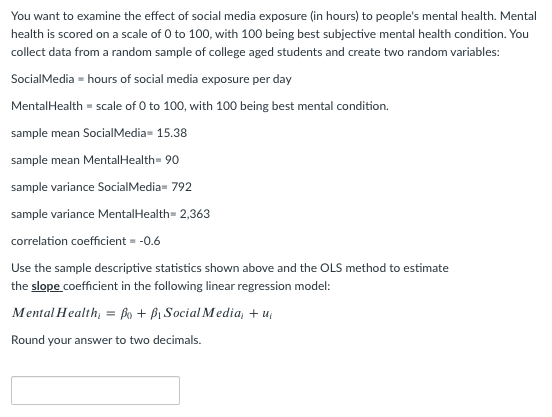
Transcribed Image Text:You want to examine the effect of social media exposure (in hours) to people's mental health. Mental
health is scored on a scale of 0 to 100, with 100 being best subjective mental health condition. You
collect data from a random sample of college aged students and create two random variables:
SocialMedia = hours of social media exposure per day
MentalHealth = scale of 0 to 100, with 100 being best mental condition.
sample mean SocialMedia- 15.38
sample mean MentalHealth= 90
sample variance SocialMedia- 792
sample variance MentalHealth= 2,363
correlation coefficient = -0.6
Use the sample descriptive statistics shown above and the OLS method to estimate
the slope coefficient in the following linear regression model:
Mental Health; = Bo + Bi Social Media, + u;
Round your answer to two decimals.
Expert Solution
This question has been solved!
Explore an expertly crafted, step-by-step solution for a thorough understanding of key concepts.

This is a popular solution!

Trending now
This is a popular solution!

Step by step
Solved in 2 steps with 2 images

Knowledge Booster


Learn more about
Need a deep-dive on the concept behind this application? Look no further. Learn more about this topic, statistics and related others by exploring similar questions and additional content below.Recommended textbooks for you
College Algebra (MindTap Course List)
Algebra
ISBN:
9781305652231
Author:
R. David Gustafson, Jeff Hughes
Publisher:
Cengage Learning

Glencoe Algebra 1, Student Edition, 9780079039897…
Algebra
ISBN:
9780079039897
Author:
Carter
Publisher:
McGraw Hill

College Algebra (MindTap Course List)
Algebra
ISBN:
9781305652231
Author:
R. David Gustafson, Jeff Hughes
Publisher:
Cengage Learning
Glencoe Algebra 1, Student Edition, 9780079039897…
Algebra
ISBN:
9780079039897
Author:
Carter
Publisher:
McGraw Hill