You will be finding a 99% Confidence Interval for the mean quantitative scores for young women, by going through the following steps: 1a) Check that the normality assumptions are met? Explain why or why not the normality assumptions are met.
You will be finding a 99% Confidence Interval for the mean quantitative scores for young women, by going through the following steps: 1a) Check that the normality assumptions are met? Explain why or why not the normality assumptions are met.

MATLAB: An Introduction with Applications
6th Edition
ISBN:9781119256830
Author:Amos Gilat
Publisher:Amos Gilat
Chapter1: Starting With Matlab
Section: Chapter Questions
Problem 1P

Related questions

Question
Transcribed Image Text:WAMAP - Gradebook
WAMAR
10 Tips for Building a More LGBT X
b radiant defense by rodan and
A https://www.wamap.org/assess2/?cid=24384&aid=1204678#/skip/1
vamap.org
Home | My Classes - | User Settings | Log Out
ourse
Messages
Forums
Calendar
Gradebook
ome > Math 146 Fa20 OL > Assessment
lodule 7 Written Homework
core: 0/40
0/8 answered
Question 1
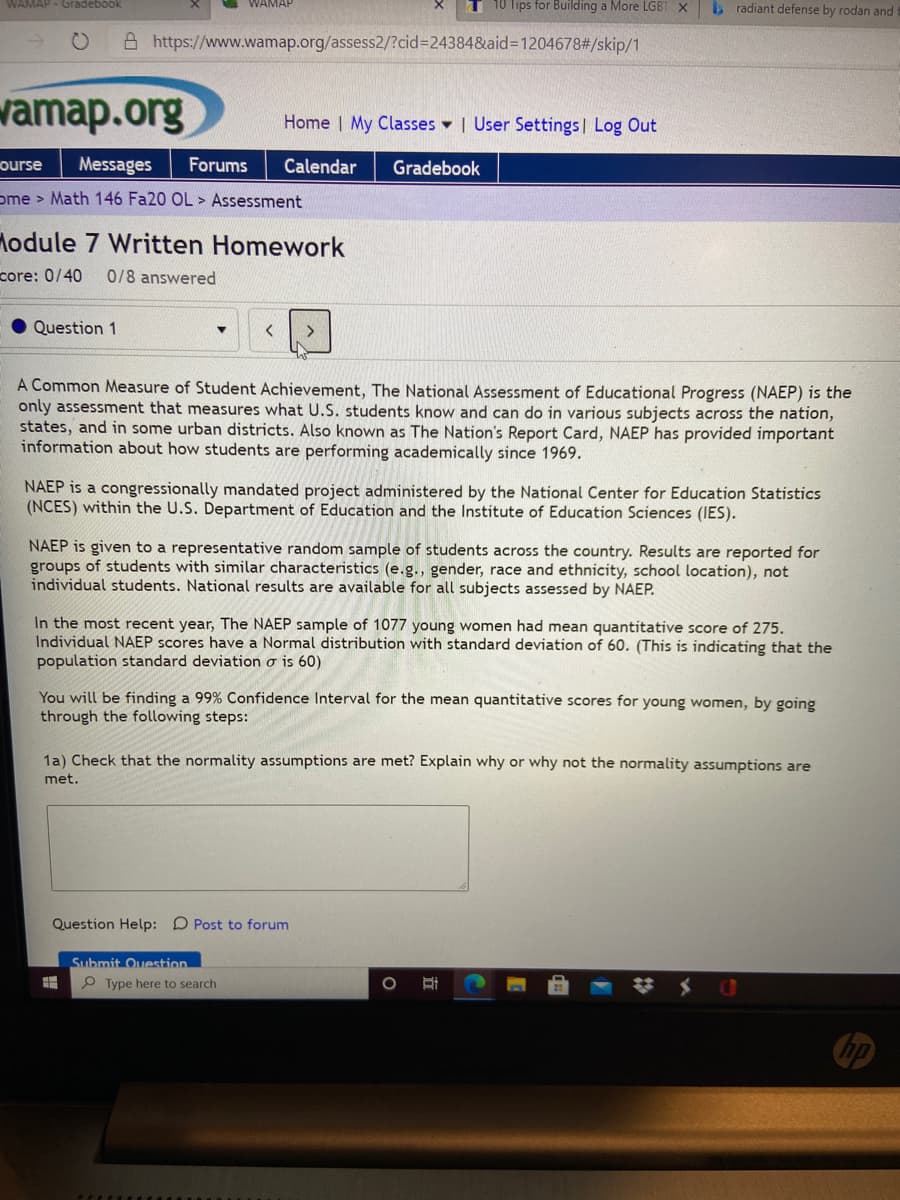
A Common Measure of Student Achievement, The National Assessment of Educational Progress (NAEP) is the
only assessment that measures what U.S. students know and can do in various subjects across the nation,
states, and in some urban districts. Also known as The Nation's Report Card, NAEP has provided important
information about how students are performing academically since 1969.
NAEP is a congressionally mandated project administered by the National Center for Education Statistics
(NCES) within the U.S. Department of Education and the Institute of Education Sciences (IES).
NAEP is given to a representative random sample of students across the country. Results are reported for
groups of students with similar characteristics (e.g., gender, race and ethnicity, school location), not
individual students. National results are available for all subjects assessed by NAEP.
In the most recent year, The NAEP sample of 1077 young women had mean quantitative score of 275.
Individual NAEP scores have a Normal distribution with standard deviation of 60. (This is indicating that the
population standard deviation o is 60)
You will be finding a 99% Confidence Interval for the mean quantitative scores for young women, by going
through the following steps:
1a) Check that the normality assumptions are met? Explain why or why not the normality assumptions are
met.
Question Help: D Post to forum
Submit Ouestion
P Type here to search
Expert Solution
This question has been solved!
Explore an expertly crafted, step-by-step solution for a thorough understanding of key concepts.

This is a popular solution!

Trending now
This is a popular solution!

Step by step
Solved in 2 steps with 5 images

Knowledge Booster


Learn more about
Need a deep-dive on the concept behind this application? Look no further. Learn more about this topic, statistics and related others by exploring similar questions and additional content below.Recommended textbooks for you
MATLAB: An Introduction with Applications
Statistics
ISBN:
9781119256830
Author:
Amos Gilat
Publisher:
John Wiley & Sons Inc

Probability and Statistics for Engineering and th…
Statistics
ISBN:
9781305251809
Author:
Jay L. Devore
Publisher:
Cengage Learning

Statistics for The Behavioral Sciences (MindTap C…
Statistics
ISBN:
9781305504912
Author:
Frederick J Gravetter, Larry B. Wallnau
Publisher:
Cengage Learning
MATLAB: An Introduction with Applications
Statistics
ISBN:
9781119256830
Author:
Amos Gilat
Publisher:
John Wiley & Sons Inc
Probability and Statistics for Engineering and th…
Statistics
ISBN:
9781305251809
Author:
Jay L. Devore
Publisher:
Cengage Learning
Statistics for The Behavioral Sciences (MindTap C…
Statistics
ISBN:
9781305504912
Author:
Frederick J Gravetter, Larry B. Wallnau
Publisher:
Cengage Learning

Elementary Statistics: Picturing the World (7th E…
Statistics
ISBN:
9780134683416
Author:
Ron Larson, Betsy Farber
Publisher:
PEARSON

The Basic Practice of Statistics
Statistics
ISBN:
9781319042578
Author:
David S. Moore, William I. Notz, Michael A. Fligner
Publisher:
W. H. Freeman

Introduction to the Practice of Statistics
Statistics
ISBN:
9781319013387
Author:
David S. Moore, George P. McCabe, Bruce A. Craig
Publisher:
W. H. Freeman