You wish to test the following claim (Ha) at a significance level of a = 0.02. H,: P1 – 42 = 0 Ha: P1 – 42 > 0 You obtain the following two samples of data. Sample #2 Sample #1 61.3 63.5 47.7 51.2 52 39.2 59.7 53.3 54.7 51 54.2 45.5 55.6 46.6 65.3 33 54 48.4 46.6 49.2 65.8 58.6 53.4 49.4 54 54.7 67.7 41.4 47.1 46.1 34 55.4 57.7 55.5 40.7 54.2 Do not test the sample variances using Fcdf. Assume the sample variances are not equal and DO NOT POOL. What is the test statistic for this sample? (Report answer accurate to three decimal places.) test statistic = What is the p-value for this sample? For this calculation, use the degrees of freedom reported from the technology you are using. (Report answer accurate to four decimal places.) p-value = The p-value is... O less than (or equal to) a greater than a
You wish to test the following claim (Ha) at a significance level of a = 0.02. H,: P1 – 42 = 0 Ha: P1 – 42 > 0 You obtain the following two samples of data. Sample #2 Sample #1 61.3 63.5 47.7 51.2 52 39.2 59.7 53.3 54.7 51 54.2 45.5 55.6 46.6 65.3 33 54 48.4 46.6 49.2 65.8 58.6 53.4 49.4 54 54.7 67.7 41.4 47.1 46.1 34 55.4 57.7 55.5 40.7 54.2 Do not test the sample variances using Fcdf. Assume the sample variances are not equal and DO NOT POOL. What is the test statistic for this sample? (Report answer accurate to three decimal places.) test statistic = What is the p-value for this sample? For this calculation, use the degrees of freedom reported from the technology you are using. (Report answer accurate to four decimal places.) p-value = The p-value is... O less than (or equal to) a greater than a

Glencoe Algebra 1, Student Edition, 9780079039897, 0079039898, 2018
18th Edition
ISBN:9780079039897
Author:Carter
Publisher:Carter
Chapter10: Statistics
Section10.4: Distributions Of Data
Problem 19PFA

Related questions
Topic Video
Question
100%
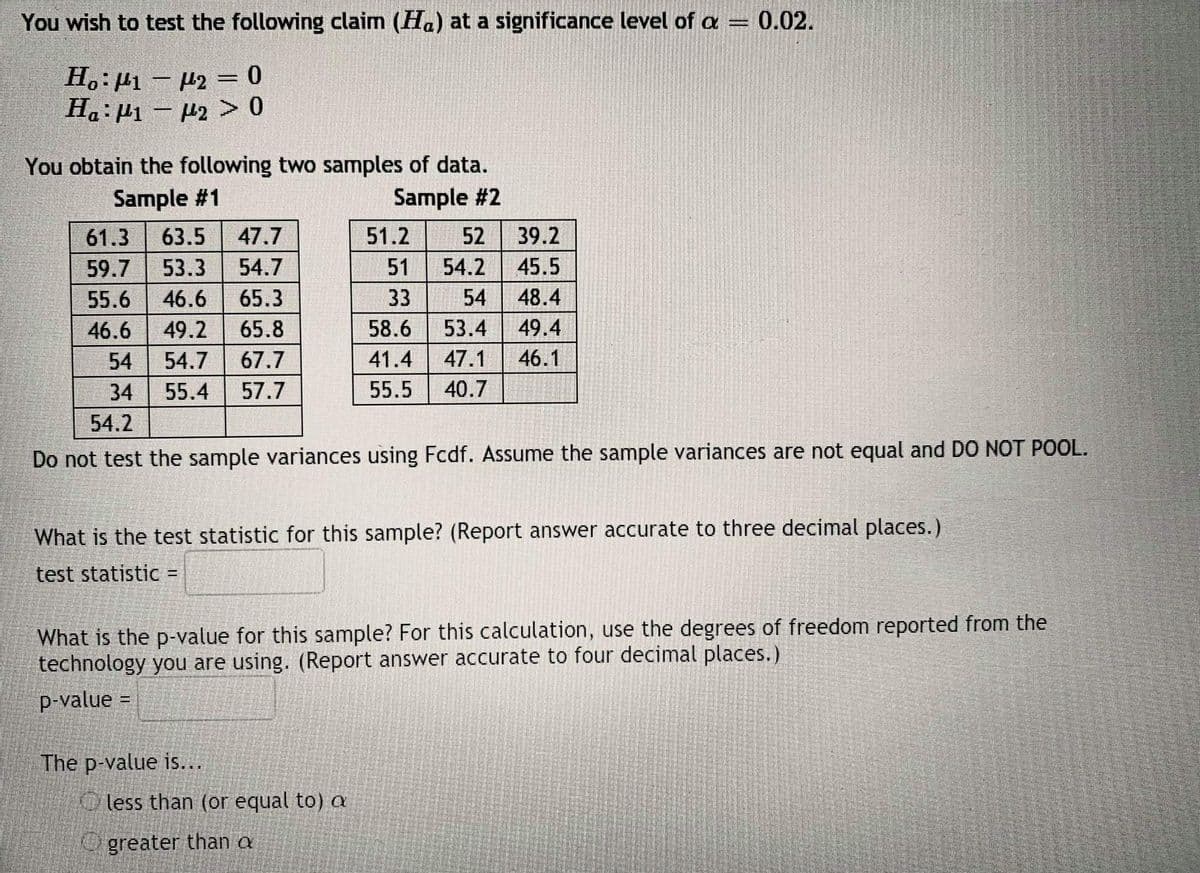
Transcribed Image Text:You wish to test the following claim (Ha) at a significance level of a = 0.02.
H.:µ1 – µ2 =0
Ha:µ1 – P2 > 0
||
You obtain the following two samples of data.
Sample #2
Sample #1
61.3
63.5
47.7
51.2
52
39.2
59.7
53.3
54.7
51
54.2
45.5
55.6
46.6
65.3
33
54
48.4
46.6
49.2
65.8
58.6
53.4
49.4
54
54.7 67.7
41.4
47.1
46.1
34
55.4
57.7
55.5
40.7
54.2
Do not test the sample variances using Fcdf. Assume the sample variances are not equal and DO NOT POOL.
What is the test statistic for this sample? (Report answer accurate to three decimal places.)
test statistic =
What is the p-value for this sample? For this calculation, use the degrees of freedom reported from the
technology you are using. (Report answer accurate to four decimal places.)
p-value =
The p-value is...
Oless than (or equal to) a
Ogreater than a
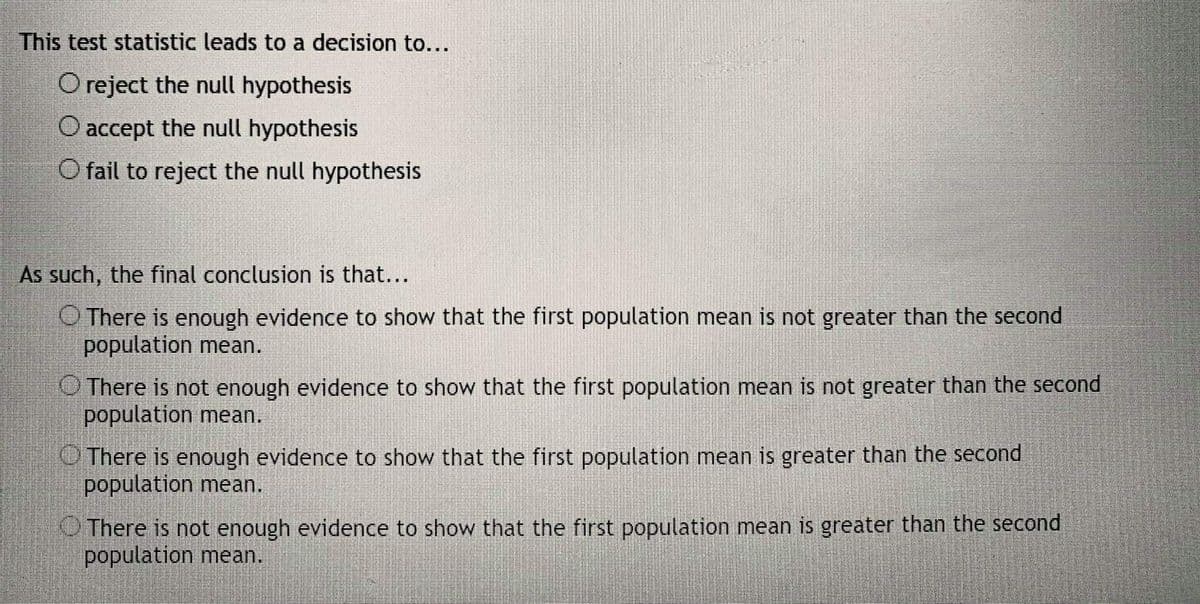
Transcribed Image Text:This test statistic leads to a decision to...
O reject the null hypothesis
O accept the null hypothesis
O fail to reject the null hypothesis
As such, the final conclusion is that...
O There is enough evidence to show that the first population mean is not greater than the second
population mean.
O There is not enough evidence to show that the first population mean is not greater than the second
population mean.
OThere is enough evidence to show that the first population mean is greater than the second
population mean.
O There is not enough evidence to show that the first population mean is greater than the second
population mean.
Expert Solution
This question has been solved!
Explore an expertly crafted, step-by-step solution for a thorough understanding of key concepts.

This is a popular solution!

Trending now
This is a popular solution!

Step by step
Solved in 3 steps with 5 images

Knowledge Booster


Learn more about
Need a deep-dive on the concept behind this application? Look no further. Learn more about this topic, statistics and related others by exploring similar questions and additional content below.Recommended textbooks for you
Glencoe Algebra 1, Student Edition, 9780079039897…
Algebra
ISBN:
9780079039897
Author:
Carter
Publisher:
McGraw Hill
Glencoe Algebra 1, Student Edition, 9780079039897…
Algebra
ISBN:
9780079039897
Author:
Carter
Publisher:
McGraw Hill