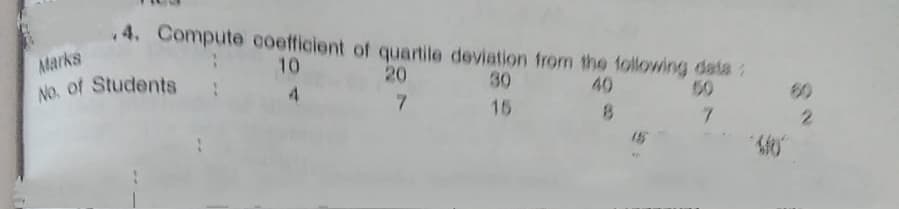
4. Compute coefficient of quartile deviation from the following data : Marks 10 20 30 40 No. of Students 50 60 4. 15


Q: The following are the particulars of the weight of boys and girls in a class. Вoys Girls Numbers 100…
A: To calculate the combined standard deviation, use the following formulae. Combined Mean,…
Q: 3. Find out the value of quartile deviation and its coefficient from the follev dadi. Roll No. 1 4…
A:
Q: Compute Quartile Deviation of the following data: Wages 100 140 180 200 240 300 320 Workers 10 16 14…
A: Given data is Wages 100 140 180 200 240 300 320 Workers 5 7 10 16 14 8 4
Q: 6. The following data is given: Average Domestic animals Number of Types of Animals Standard…
A:
Q: Calculate Coefficient of Concurrent Deviation from the following data: X: 1 2 3 5 6. y: 25 16 5 1
A: Solution:
Q: Suppose two samples of human males yield the following results. Sample 1 25 years | 145 pounds…
A: Based on given information, both sample 1 and sample 2 has standard deviation of 10 pounds. This…
Q: 11. What is the relationship between the standard deviation of the sample mean se( X), for samples…
A: Standard deviation of sample mean is also know as Standard error
Q: Consider the following sample: 10 12 14 20 31 35 40 40 55 55 57 63…
A: Solution: From the given information, the mean is 47.1250 and standard deviation is 26.1938.
Q: 22 Find the median, two quartiles and Bowely's coefficient of skewness or the following data : farks…
A: Given data : Marks below 10 20 30 40 50 60 70 80 No. of students 15 35 60 84 96 127 198 250
Q: - 6-6. Calculate mean deviation from median of the following distribution. Class Interval 50 100 100…
A:
Q: Consider the following sample: 25 47 62 93 100 the mean and sample standard deviation…
A:
Q: -32. Calculate Coefficient of Concurrent Deviations from the data given below : No. of Workers: 300…
A:
Q: Consider the following sample: 15 24 25 29 31 36 73 85 94 96 100 the mean…
A:
Q: Calculate the quartile deviation and coeficient fron Roll No. 1 3 4 6. Marks 12 35 20 18 64 52
A: Quartiles are partition values that divide the series into four equal parts for which three points…
Q: 2. Find the range and sample variance of the following numbers: 12 13 45 16 12 12 10 10 13 15 3.…
A: For the given data Find ( 2 ) Range =? Sample variance =? ( 3 ) popultion s.d =? Sample s.d =? ( 4 )…
Q: Coefficient of skewness b. Mean c. Median d. Standard deviation
A: Provided data is: 132, 144, 127, 152, 101 and 165. Arranging data in ascending order; 101, 127, 132,…
Q: Calculate the quartile deviation and its Coefficient from the following data. Class-Interval…
A:
Q: 4. The following data are the temperatures (in °C) of effluent at discharge from a sewage treatment…
A:
Q: The data to the right contain the state cigarette tax (in $) for all 20 regions of a country. 1.36…
A: Given that The state cigarette tax (in $) for all 20 regions of a country. 1.36 ,1.70 , 2.51 , 0.45…
Q: Cigarettes consumed per capita in 1930 (X) 530 Observation # Country Lung cancer deaths per million…
A: Sample mean is the average of a sample dataset and it is computed by dividing the sum of…
Q: d the mean, variance and standard deviation of the following data: X 19 20 21 22 23 P(X) 0.2 0.2 0.3…
A: From the given information we find the solution.
Q: Which of the following levels of variability (standard deviation or variance) would most likely…
A: The platykurtic curve has shorter peak and thinner tail compared to normal distribution. The excess…
Q: 1) The following data represent the number automobiles arriving at a toll booth during 20 intervals,…
A:
Q: 7. Compute mean deviation from mean and median from the following data : Height in cms 158 159 160…
A: Given data is Heights in cms 158 159 160 161 162 163 164 165 166 No.of persons 15 20 32 35 33…
Q: 3. Find out the value of quartile deviation and its coefficient from the following data Roll No. 3…
A:
Q: Q5 Calculate Quartile Deviation and its Coefficient from the following data Weight (in pounds) 120…
A:
Q: The following set of data is from a sample of n=6. 6 59 6 3 13 O a. Compute the mean, median, and…
A: a. given data sample 6, 5, 9, 6, 3, 13 Mean = (sum of observations)/(Number of observations) Mean =…
Q: 10 The following table shows the frequency distribution of the number of children at a childcare…
A: Calculating the mean of the data Class Interval Frequency (f) X Xf 1-2 12 1.5 18 2-3 8 2.5 20…
Q: 2. Assume that the length of human forearms is symmetric, unimodal and bell-shaped with mean 12in.…
A: a. The Z-score of a random variable X is defined as follows: Z = (X – µ)/σ. Here, µ and σ are the…
Q: 8. Which of the following measures of central tendencies is most appropriate if the data can be…
A: Mean: The arithmetic mean (also called the mean) is the most commonly used measure of central…
Q: Find the interquartile range and the Coefficient of quartile deviation from the followine data Marks…
A:
Q: I need a solution that shows every step and includes curve.I am really bad at statistics and i will…
A:
Q: #7. For the sample data 14.8 12.7 18.0 14.5 12.3 10.5 9.1 8.3 (a) Compute the sample mean x, sample…
A: The number of observation n is 8.
Q: Consider the following set of ungrouped sample data. Answer parts A through D. 3 3 4 4 0 2 16 6 70…
A:
Q: Compute cocfficient of quartile deviation from the following data: 50 Marks 10 40 80 30 15 20 No. of…
A: Given The data is as follows: Marks No. of students 10 4 20 7 30 15 40 8 50 7 80 2
Q: = 26 : Calculate Standard deviation of the following data. No. of Employees : 10-19 No. of firms…
A: Here given grouped data with frequency From given table calculation is on further step
Q: / Example 11. Find the mean deviation from (i) mean and (ii) median for the following daia: Marks :…
A:
Q: For the following sample data 9. 10 12 Compute the following measures: (Please keep two decimal…
A: a. There are total 6 observations.
Q: Find the Quartile Deviation and its Coefficient from the following data, relating to the wéekly…
A: Given that The data are50,70,80,60,65,40,90
Q: Consider the data with analysis shown in the following computer output: Level N Mean StDev A 6…
A: Pooled standard deviation: Pooled standard deviation is simply the square root of Mean square error…
Q: 2. The following are the scores of two groups of students who took the make-up test in Statistics…
A: The scores of group A and group B of students are given. We have to find coefficient of variation.
Q: the following are the scores of ten ABM students in their fourth-quarter examination: 26 37 45 35…
A: Solution: Let X be the scores. The given data is 26, 37, 45, 35, 31, 47, 23, 34, 44 and 38.
Q: Q) Consider the following ungrouped data: 18 11 22 19 24 24 23 10 11 16…
A: Mean is the average value around which the whole data set is concentrated. Mean for the set of 'n'…
Q: 6. The following data is given: Number of animals 15 5 5 Average Domestic animals 2 Types of Animals…
A: Types of Animal n x s s2 Dogs 5 2 1 1 Cats 5 3 1.87 3.4969 Hamster 5 4 1.41 1.9881 p = 3 n…
Q: 2. Find the range and sample variance of the following numbers: 12 13 45 16 12 12 10 10 13 15 3.…
A: The question is about descriptive statistics
Q: Compute coefficient of quartile deviation from the following data : Marks 10 20 30 40 50 60 No. of…
A:
Q: Suppose we have the following paired observations of variables X and Y: X Y 8 0 4…
A: Solution: The given data is
Q: Use the following Frequency table to calculate the standerd deviation. Class Frequency…
A: Here, Class Interval Frequency, f Midpoint, x fx x2 fx2 2-4 4 3 12 9 36 5-7 6 6 36 36 216…
Q: . Compute Standard deviation from the following data 60 Marks 10 20 30 40 50 No. of students 20 7 3.…
A: Solution is given: Give data:
Q: 1. FILE The following sample of observations were randomly selected. 3 6 10 4 4 6. Determine the…
A: Since you have asked multiple question, we will solve the first question for you. If you want any…

Step by step
Solved in 2 steps with 2 images
