You wish to test the following claim (HaHa) at a significance level of α=0.002α=0.002. Ho:μ1=μ2Ho:μ1=μ2 Ha:μ1>μ2Ha:μ1>μ2 You obtain the following two samples of data. What is the test statistic for this sample? (Report answer accurate to three decimal places.) test statistic = What is the p-value for this sample? For this calculation, use the degrees of freedom reported from the technology you are using. (Report answer accurate to four decimal places.) p-value = The p-value is... less than (or equal to) αα greater than αα
You wish to test the following claim (HaHa) at a significance level of α=0.002α=0.002. Ho:μ1=μ2Ho:μ1=μ2 Ha:μ1>μ2Ha:μ1>μ2 You obtain the following two samples of data. What is the test statistic for this sample? (Report answer accurate to three decimal places.) test statistic = What is the p-value for this sample? For this calculation, use the degrees of freedom reported from the technology you are using. (Report answer accurate to four decimal places.) p-value = The p-value is... less than (or equal to) αα greater than αα

MATLAB: An Introduction with Applications
6th Edition
ISBN:9781119256830
Author:Amos Gilat
Publisher:Amos Gilat
Chapter1: Starting With Matlab
Section: Chapter Questions
Problem 1P

Related questions
Question
You wish to test the following claim (HaHa) at a significance level of α=0.002α=0.002. Ho:μ1=μ2Ho:μ1=μ2
Ha:μ1>μ2Ha:μ1>μ2 You obtain the following two samples of data.
What is the test statistic for this sample? (Report answer accurate to three decimal places.)
test statistic =
What is the p-value for this sample? For this calculation, use the degrees of freedom reported from the technology you are using. (Report answer accurate to four decimal places.)
p-value =
The p-value is...
- less than (or equal to) αα
- greater than αα
This test statistic leads to a decision to...
- reject the null
- accept the null
- fail to reject the null
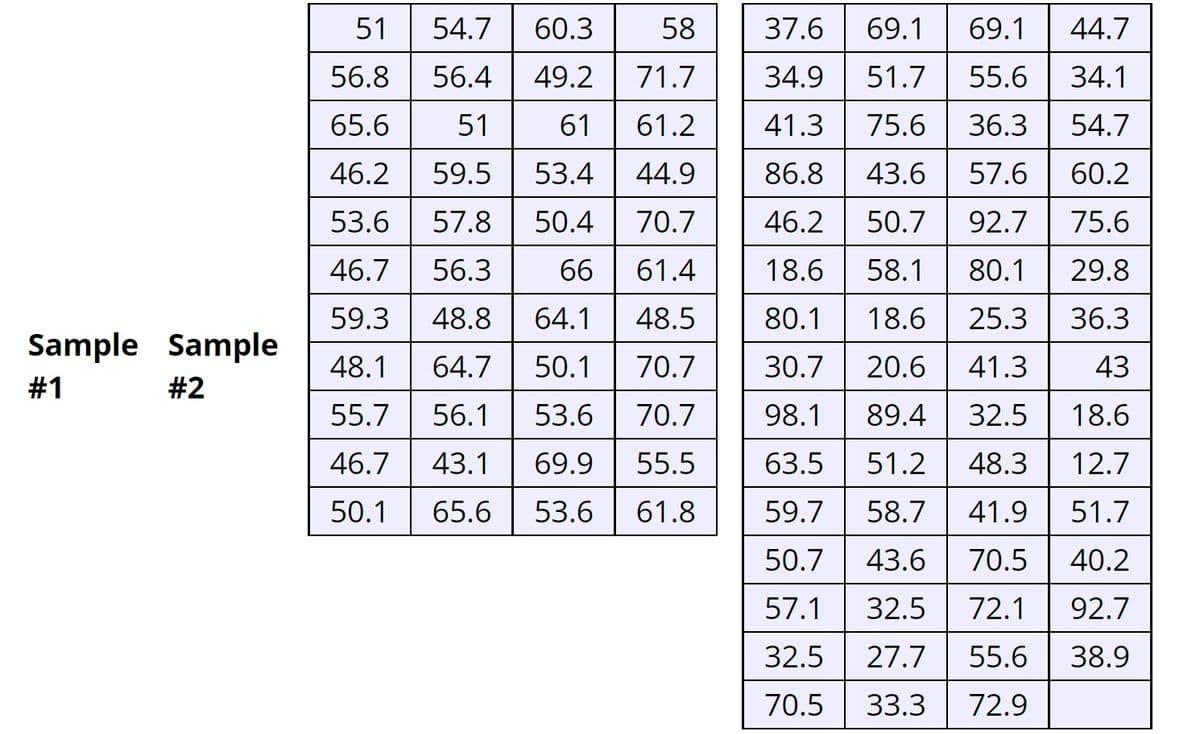
Transcribed Image Text:51
54.7
60.3
58
37.6
69.1
69.1
44.7
56.8
56.4
49.2
71.7
34.9
51.7
55.6
34.1
65.6
51
61
61.2
41.3
75.6
36.3
54.7
46.2
59.5
53.4
44.9
86.8
43.6
57.6
60.2
53.6
57.8
50.4
70.7
46.2
50.7
92.7
75.6
46.7
56.3
66
61.4
18.6
58.1
80.1
29.8
59.3
48.8
64.1
48.5
80.1
18.6
25.3
36.3
Sample Sample
48.1
64.7
50.1
70.7
30.7
20.6
41.3
43
#1
#2
55.7
56.1
53.6
70.7
98.1
89.4
32.5
18.6
46.7
43.1
69.9 55.5
63.5
51.2
48.3
12.7
50.1
65.6
53.6
61.8
59.7
58.7
41.9
51.7
50.7
43.6
70.5
40.2
57.1
32.5
72.1
92.7
32.5
27.7
55.6
38.9
70.5
33.3
72.9
Expert Solution
This question has been solved!
Explore an expertly crafted, step-by-step solution for a thorough understanding of key concepts.

This is a popular solution!

Trending now
This is a popular solution!

Step by step
Solved in 6 steps with 4 images

Recommended textbooks for you
MATLAB: An Introduction with Applications
Statistics
ISBN:
9781119256830
Author:
Amos Gilat
Publisher:
John Wiley & Sons Inc

Probability and Statistics for Engineering and th…
Statistics
ISBN:
9781305251809
Author:
Jay L. Devore
Publisher:
Cengage Learning

Statistics for The Behavioral Sciences (MindTap C…
Statistics
ISBN:
9781305504912
Author:
Frederick J Gravetter, Larry B. Wallnau
Publisher:
Cengage Learning
MATLAB: An Introduction with Applications
Statistics
ISBN:
9781119256830
Author:
Amos Gilat
Publisher:
John Wiley & Sons Inc
Probability and Statistics for Engineering and th…
Statistics
ISBN:
9781305251809
Author:
Jay L. Devore
Publisher:
Cengage Learning
Statistics for The Behavioral Sciences (MindTap C…
Statistics
ISBN:
9781305504912
Author:
Frederick J Gravetter, Larry B. Wallnau
Publisher:
Cengage Learning

Elementary Statistics: Picturing the World (7th E…
Statistics
ISBN:
9780134683416
Author:
Ron Larson, Betsy Farber
Publisher:
PEARSON

The Basic Practice of Statistics
Statistics
ISBN:
9781319042578
Author:
David S. Moore, William I. Notz, Michael A. Fligner
Publisher:
W. H. Freeman

Introduction to the Practice of Statistics
Statistics
ISBN:
9781319013387
Author:
David S. Moore, George P. McCabe, Bruce A. Craig
Publisher:
W. H. Freeman