You would like to determine if there is a statistical relationship between the amount of caffein in a cup of coffee and their sales at their coffee franchises. The data is included in the set "Coffee by the Cup". Here is information about the variables. Variable Caffeine Cups Sold Measurement Amount of caffeine in one cup Number of cups of the coffee sold at all of the franchises Units Milligrams Cups sold a. Which variable is the explanatory variable and which variable is the response variable? b. Construct a scatterplot of the data. Based upon the scatterplot is there a linear relationship between the amount of caffeine in one cup of the coffee and the number of cups of coffee sold? Justify your reasoning using the scatterplot. c. Run a t-test for correlation using technology. Make sure you include the p-value and the printout. According to the t-test, is there a statistical relationship between the amount of caffeine in a cup of coffee and the number of cups sold? Justify your reasoning using the results of the test.

Glencoe Algebra 1, Student Edition, 9780079039897, 0079039898, 2018
18th Edition
ISBN:9780079039897
Author:Carter
Publisher:Carter
Chapter10: Statistics
Section10.6: Summarizing Categorical Data
Problem 27PPS
icon
Related questions
icon
Concept explainers
Question
3. You would like to determine if there is a statistical relationship between the amount of caffein in
a cup of coffee and their sales at their coffee franchises. The data is included in the set "Coffee
by the Cup". Here is information about the variables.
Variable
Caffeine
Cups Sold
Measurement
Amount of caffeine in one cup
Number of cups of the coffee
Units
Milligrams
Cups sold
sold at all of the franchises
a. Which variable is the explanatory variable and which variable is the response variable?
b. Construct a scatterplot of the data. Based upon the scatterplot is there a linear relationship
between the amount of caffeine in one cup of the coffee and the number of cups of coffee
sold? Justify your reasoning using the scatterplot.
c. Run a t-test for correlation using technology. Make sure you include the p-value and the
printout. According to the t-test, is there a statistical relationship between the amount of
caffeine in a cup of coffee and the number of cups sold? Justify your reasoning using the
results of the test.
d. Find the correlation coefficient for caffeine and cups of coffee sold.
a. Interpret the correlation coefficient in terms of its strength and direction.
b. Complete the following sentence: According to the correlation coefficient, If you
(increase/decrease) the amount of a caffeine in a cup of coffee, then this will
(increase/decrease) the number of cups sold. Choose either increase or decrease for
each of the blanks.
Or write:
There is no relationship between the amount of caffeine in a cup of coffee and the
number of cups sold.
e. What percentage of the variability in the number of cups sold is on account of the amount of
caffeine in each cup? Explain how you know.
f. State the linear regression line (you should use technology to find it). Determine based upon
the information from b-d whether or not the regression line is appropriate to use to predict
the number of cups sold based upon the amount of caffeine in the cups.
g. Predict the number of cups that would be sold if the amount of caffeine in the cup with 200
mg of caffeine.
mg of Caffeine Cups Sold
155
1215
200
1311
175
564
235
1900
247
1750
258
1427
180
280
205
750
310
2100
178
789
256
1500
288
1670
290
2000
199
1233
260
1400
Transcribed Image Text:3. You would like to determine if there is a statistical relationship between the amount of caffein in a cup of coffee and their sales at their coffee franchises. The data is included in the set "Coffee by the Cup". Here is information about the variables. Variable Caffeine Cups Sold Measurement Amount of caffeine in one cup Number of cups of the coffee Units Milligrams Cups sold sold at all of the franchises a. Which variable is the explanatory variable and which variable is the response variable? b. Construct a scatterplot of the data. Based upon the scatterplot is there a linear relationship between the amount of caffeine in one cup of the coffee and the number of cups of coffee sold? Justify your reasoning using the scatterplot. c. Run a t-test for correlation using technology. Make sure you include the p-value and the printout. According to the t-test, is there a statistical relationship between the amount of caffeine in a cup of coffee and the number of cups sold? Justify your reasoning using the results of the test. d. Find the correlation coefficient for caffeine and cups of coffee sold. a. Interpret the correlation coefficient in terms of its strength and direction. b. Complete the following sentence: According to the correlation coefficient, If you (increase/decrease) the amount of a caffeine in a cup of coffee, then this will (increase/decrease) the number of cups sold. Choose either increase or decrease for each of the blanks. Or write: There is no relationship between the amount of caffeine in a cup of coffee and the number of cups sold. e. What percentage of the variability in the number of cups sold is on account of the amount of caffeine in each cup? Explain how you know. f. State the linear regression line (you should use technology to find it). Determine based upon the information from b-d whether or not the regression line is appropriate to use to predict the number of cups sold based upon the amount of caffeine in the cups. g. Predict the number of cups that would be sold if the amount of caffeine in the cup with 200 mg of caffeine. mg of Caffeine Cups Sold 155 1215 200 1311 175 564 235 1900 247 1750 258 1427 180 280 205 750 310 2100 178 789 256 1500 288 1670 290 2000 199 1233 260 1400
Expert Solution
Step 1

a)

In the above example number of  cups of the coffee sold is the response variable and amount of caffeine  in a cup is the explanatory  variable. as we wanted to study the statistical relationship between number of coffee sold and amount of  caffeine .


b) scatter plot -

Statistics homework question answer, step 1, image 1 

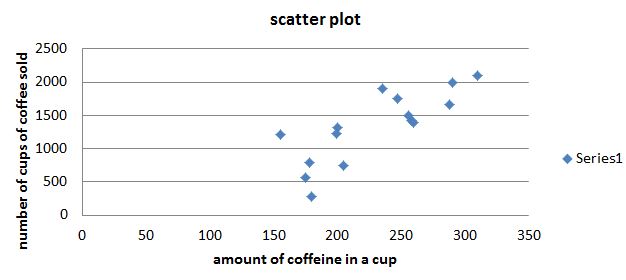
from the scatter plot we can see that there is linear relation between number of cups of coffee sold and amount of caffeine in a cup . as we can see there is no specifics patterns . if we draw a line passing through the observations most of the points may be pass through it .

Step 2

c)

we want to test the significance of the correlation between there two variable.


let us define the null and alternative hypothesis.

H0:There is no linear relation between number of cups of coffee sold and amount of caffeine            in a coffee cup.H1:There is  linear relation between number of cups of coffee sold and amount of caffeine            in a coffee cup.


level of significance=0.05

correlation coefficient =0.8021

n=15

The sample size is n = 15, so then the number of degrees of freedom is df = n-2 = 15 - 2 = 13


test statistics:

t=r*n-21-r2 =4.843

steps

Step by step

Solved in 3 steps with 1 images

Blurred answer
Knowledge Booster
Correlation, Regression, and Association
Learn more about
Need a deep-dive on the concept behind this application? Look no further. Learn more about this topic, statistics and related others by exploring similar questions and additional content below.
Recommended textbooks for you
Glencoe Algebra 1, Student Edition, 9780079039897…
Algebra
ISBN:
9780079039897
Author:
Carter
Publisher:
McGraw Hill
Big Ideas Math A Bridge To Success Algebra 1: Stu…
Algebra
ISBN:
9781680331141
Author:
HOUGHTON MIFFLIN HARCOURT
Publisher:
Houghton Mifflin Harcourt
Holt Mcdougal Larson Pre-algebra: Student Edition…
Algebra
ISBN:
9780547587776
Author:
HOLT MCDOUGAL
Publisher:
HOLT MCDOUGAL